11 November 2024
White Papers
Authors: Theo Laughner, Stan Heckman, Angel Manzur, Chris Sloop
Abstract
As the U.S. electric grid evolves to include more renewable energy sources and modernized grid components, it faces increased complexity and new challenges in maintaining power quality. Total Harmonic Distortion (THD), a measure of total voltage harmonics found within an electrical system, has become a critical metric for evaluating power quality, as excessive THD reduces the efficiency and lifespan of electrical equipment, leading to increased costs and reliability issues for consumers and utility companies. This paper examines the small-scale distribution of THD, utilizing data collected from Whisker Labs’ Ting Sensor Network. With over 1,000,000 sensors across the U.S., Ting provides insights into power quality at a granular, local level, enabling the identification of THD hotspots and trends. While most areas maintain THD within IEEE 519 standards, some utility regions experience elevated THD levels beyond acceptable standards. Additionally, events such as solar storms can temporarily spike THD, underscoring the importance of continuous monitoring. The Ting network shows that harmonic related power quality is good in most of the US. However, some locations have power quality that is considerably worse than IEEE-519 requirements and as a result experience lower energy efficiency and equipment that ages faster and costs more.
Introduction
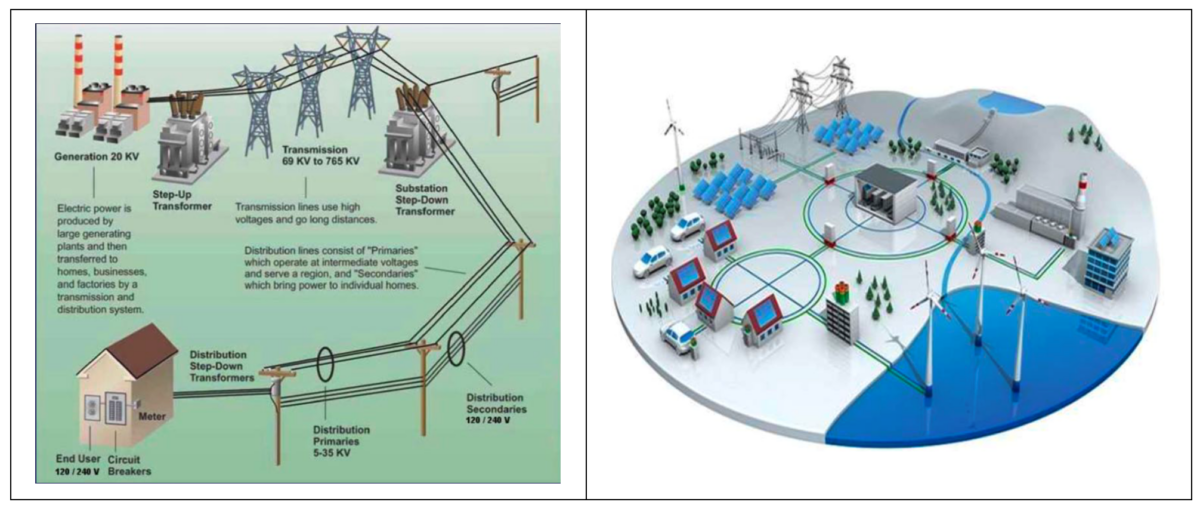
Figure 1 – Increased complexity of the modern grid
Over the past 20 years, the power system has undergone significant transformation [1] (see Figure 1). Power generation has transitioned from what was once only large synchronous machines to now include inverter-based resources, such as solar, wind and batteries, that convert a direct current (DC) to an alternating current (AC). In addition, changes in grid design now employ other active components such as capacitor banks and tap changed transformers to regulate voltage levels. These active grid components attempt to enhance power transfer and voltage stability, but when improperly tuned can become a source of voltage harmonics.
At the same time, the nature of power consumption has evolved, from primarily resistive loads to increasingly electronic loads such as computers, battery chargers, variable frequency drives (VFDs), and LED lighting. Magnetic devices, such as motors and transformers add harmonics due to their nonlinear magnetizing characteristics, load fluctuations and saturation effects. All these loads introduce harmonics which can cause large distortions to the voltage waveform [2].
The degree to which voltage harmonics are found on an electrical system is usually represented as a single measurement which is the sum impact of all harmonics. This measurement is called Total Harmonic Distortion (THD). Figure 2 shows a waveform in orange which is very distorted compared to a normal voltage waveform.

Figure 2 – Distorted Voltage Waveform vs Normal Voltage Waveform
Impact of High Harmonics
The US grid is designed to operate by generating a 60 Hertz voltage sine wave. Many devices such as motors (air conditioners, refrigerators, etc.) are designed to work most efficiently when the voltage is a perfect 60Hz sine wave. When other harmonic frequencies are present, motors will still operate but use several percent more power and have shorter lifespan. Generally, the more distorted the voltage sine wave (the higher the THD), the more power is wasted in heat in the iron and copper of the motor, decreasing energy efficiency and shortening motor lifetime. THD also causes vibrations in motors that lead to extra heat and damage over extended periods and results in a shorter operating life. High THD can also lead to malfunction of electronic controls, cause thermal impacts to grid connected equipment, and in extreme cases, catastrophic failure of grid-connected equipment. Problems and inefficiencies caused by high THD include (Mueller, Ramos, McVey, & Murphy, 2019):
- Reduced motor efficiency and life due to overheating
- Capacitor or transformer failure due to overheating
- Reduced transformer capacity and life
- Fuses blowing and breakers tripping unnecessarily
- High neutral currents which can result in stray voltages
The combined result of these impacts is an overall reduction in energy efficiency and results in real economic losses for utilities and their customers.
Harmonic Limits
Because governments and industry experts recognize the costs associated with high levels of voltage total harmonic distortion, the IEEE has created standards for which our utilities must conform. IEEE Standard 519 is entitled “IEEE Standard for Harmonic Control in Electric Power Systems”. The scope of the document is to establish recommended limits for distortion at the point of common coupling (PCC) between sources (utilities) and loads (consumers). The standard asserts that managing harmonics is a joint responsibility between both end-users and system owners or operators. Specifically, IEEE 519 specifies a limit on Total Harmonic Distortion for devices connected at less than 1,000V to 8% (IEEE, 2022). Utilities are obligated by laws set by each state to ensure the deleterious effects of harmonics do not become intolerably large for both utility and customer-owned equipment.
IEEE 519 defines the point of common coupling (PCC) as the point in the power distribution network where the utility’s responsibility ends and the customer’s system begins, often located at the main service entrance. It is the point at which multiple customers could be connected and where harmonic limits set by IEEE 519 apply.
THD Measurement Network
Whisker Labs has developed a service which helps prevent electrical fire hazards and reduce the impact of poor power quality on electricity consumers [5]. This is accomplished by consumers installing a IoT sensor device in their home or business. The combination of these sensors as a network provides detailed insight into the operation and quality of the electrical grid.
With more than 1,000,000 devices deployed, 94% of US homes have a Ting sensor within 0.5 miles. The geographic distribution of Ting sensors generally follows population density and there are a statistically significant number of sensors in every state, utility service area, and county.
Ting sensors distinguish the difference between effects which happen in a single home from effects which are external to the home by identifying events that occur at multiple sensors that are distributed geographically. For example, when multiple sensors (homes) record the same event at the same time, this is labeled a grid event because a single home cannot influence the voltage of many geographically separated homes. Faults that originate on the utility grid almost always cause voltage sags or interruptions to be simultaneously recorded by multiple Ting sensors. During a system event, other parameters like frequency and THD are also impacted.
The graph below shows 4 sensors (in 4 different homes sufficiently separated that the homes are not served by the same utility transformer) that recorded a voltage sag at the same time. The event is also roughly the same duration. Finally, the sag is the same magnitude. This is clearly caused by a fault on the utility grid since all the houses recorded the same event.

Figure 3 – Grid Voltage Sag Recorded By Multiple Sensors
Consider the set of Ting sensors in figure 4. Given the proximity of the sensors to one another, it is possible that the sensors may share a distribution feeder. If the sensors were on the same feeder, the voltage and THD would be similar magnitudes and change in similar ways. If the voltage and THD magnitudes differ or the changes in the magnitudes of the readings differ, then it would indicate that sensors are not on the same feeder. In all cases, the frequency would be the same if the sensors since all homes in large regions are connected to the same grid.
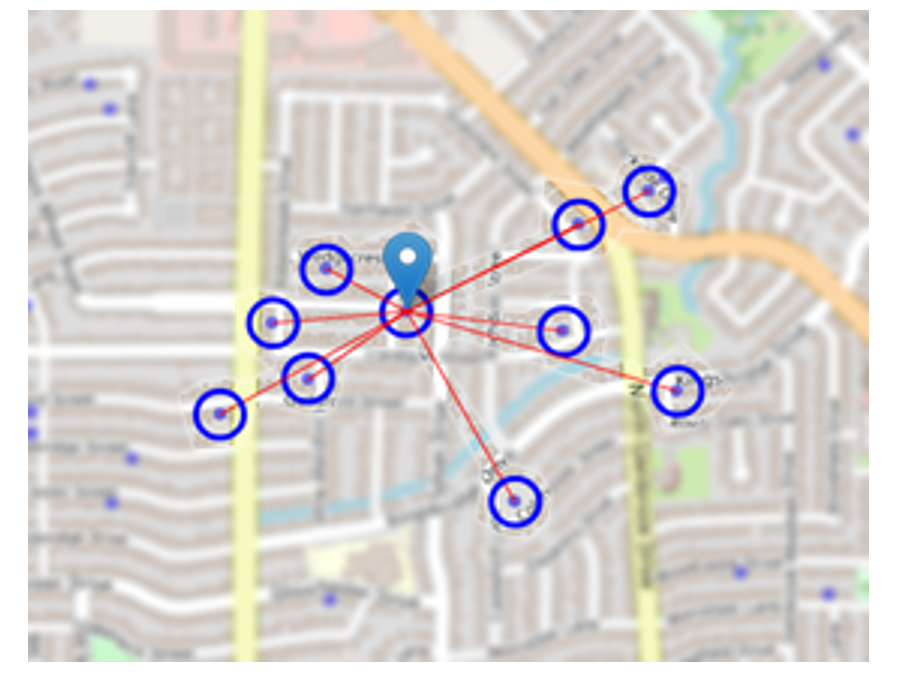
Figure 4 – Ting Sensor Locations
In the figure 5, the voltage from each of the sensors on the map is displayed. Several of the homes share a voltage profile. The orange, green, yellow, purple, red, brown, and blue traces all go down at the same time, we refer to that set of sensors as Circuit A. This is not a fault, but a system change (like a tap change or a capacitor bank switching out). However, the cyan, light blue and magenta traces do not have the same profile. This suggests that though they are close geographically, they are on one or more different feeders. For simplicity, we refer to that set of sensors as Circuit B.

Figure 5 – Voltage Change
In figure 6, the sensors on Circuit A all have similar THD. In addition to a similar THD magnitude, the THD profile changes at the same time, much like the voltage did. This is further evidence that all the sensors are on the same circuit. However, notice how the sensors on Circuit B do not have the same THD as Circuit A. This is an expected result based on the voltage profile which indicates the sensors were not on the same circuit. Also, the sensors on Circuit B show different THD levels. Some of the feeders exceed 8% during parts of the day, while other feeders are well within the IEEE 519 limit. Ting sensors are installed inside the home on the consumers side of the point of common coupling (PCC). While it is possible that devices inside the home cause harmonic distortion, when multiple, geographically separated sensors show the exact same harmonic profile at the same time, the harmonic content can be attributed to a grid sourced phenomenon. In this case, the harmonic measurements at the group of Ting sensors are representative of the harmonic measurement at the PCC.

Figure 6 – THD Trend at Geographically Close Sensors
THD Measurement at National and Local Scales
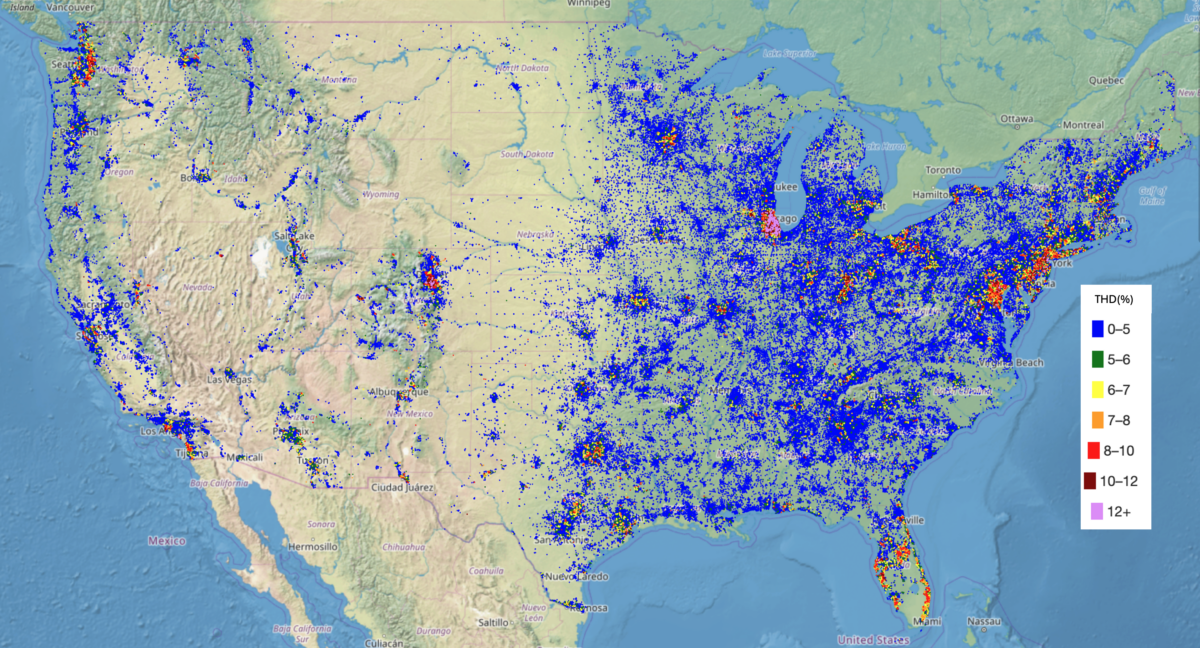
Figure 7 – A National THD measurement network
Figure 7 shows a national THD measurement network of Ting sensors. While most of the country is seen to be well within IEEE 519 limits (blue dots), there are multiple areas generally found in more densely populated areas where THD exceeds IEEE 519 limits (yellow, red and purple dots). Looking at these hotspots in more detail, it turns out these are not covering large regions but are found to be more localized to specific feeders or substations.
Because the system is based on the individual sensors, it is possible to drill down into specific neighborhoods where THD is higher than the recommended IEEE limits. Figure 8 shows the 95th percentile THD for the Ting network in the Chicago region. Each dot represents the THD as measured at the sensor. Higher THD dots are drawn on top of lower THD dots. Many of the sensors exceeded the IEEE 519 limit of 8%. While looking at the national view, this appeared to be a systemic problem. Upon closer inspection, there are groupings of higher THD areas interlaced with areas of low THD.
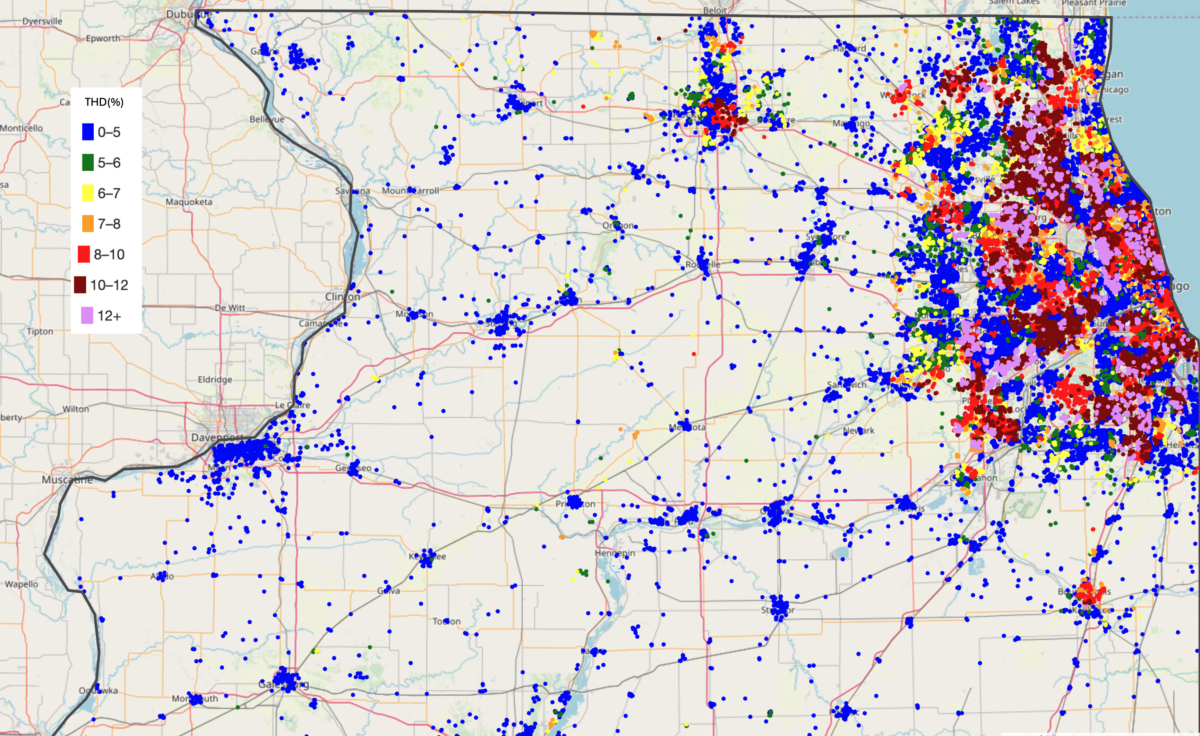
Figure 8 – Sensors in Chicago, IL, THD data for October 2024.
Similar phenomenon of high THD areas interlaced by normal THD areas can be seen in other cities and states. Figures 9 through 13 show zoomed in portions of Colorado, New Jersey, Maryland, Florida, and Louisiana. Not all highly populated areas have THD readings which the exceed IEEE 519 limit as can be seen in the plot of sensor readings in the state of Louisiana.
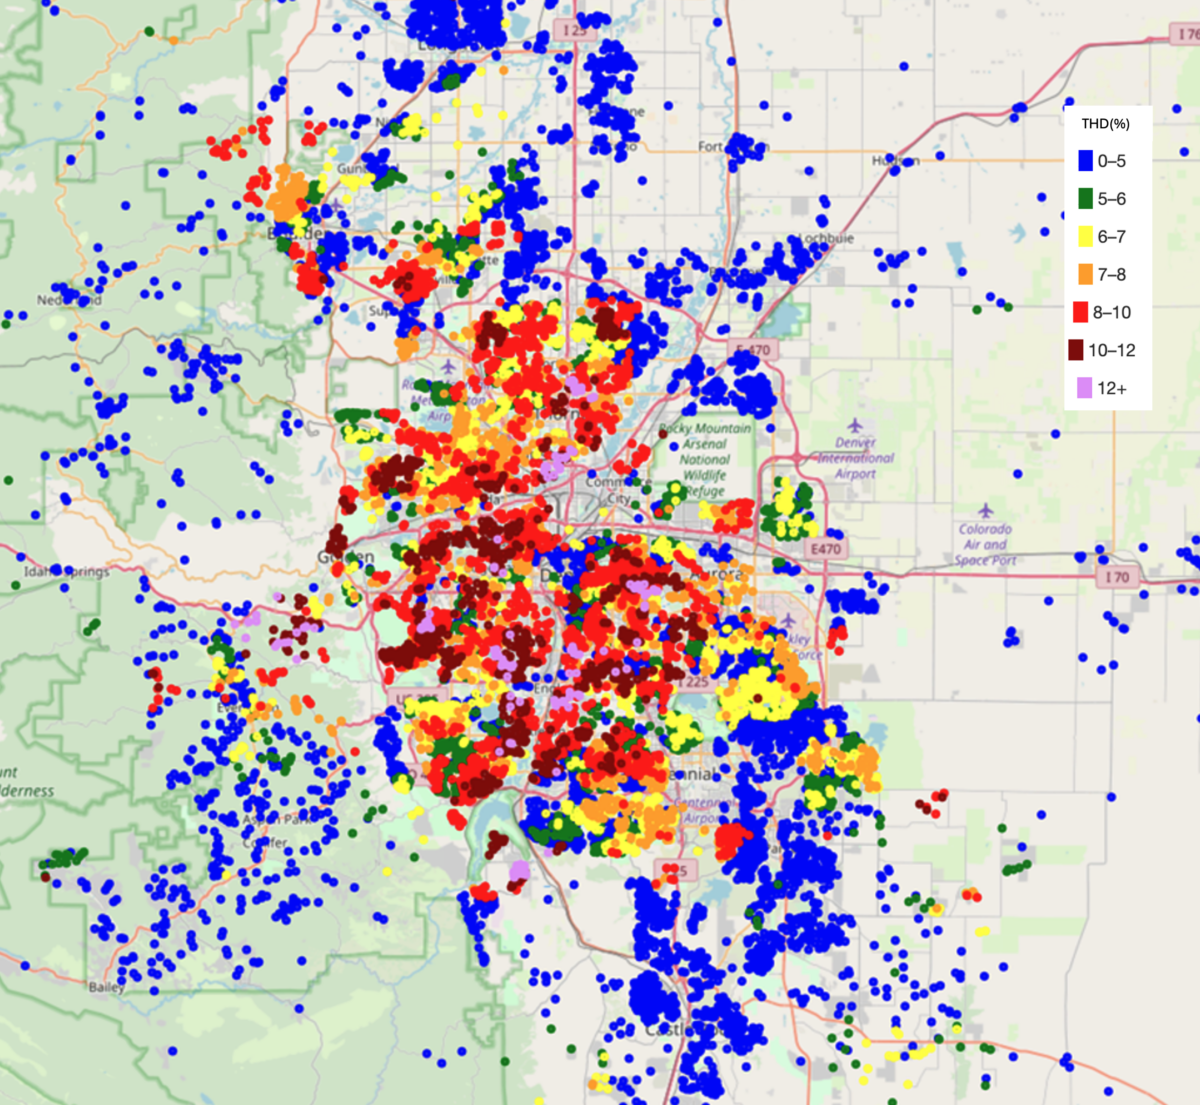
Figure 9 – Sensors in Denver, CO, THD data for October 2024.
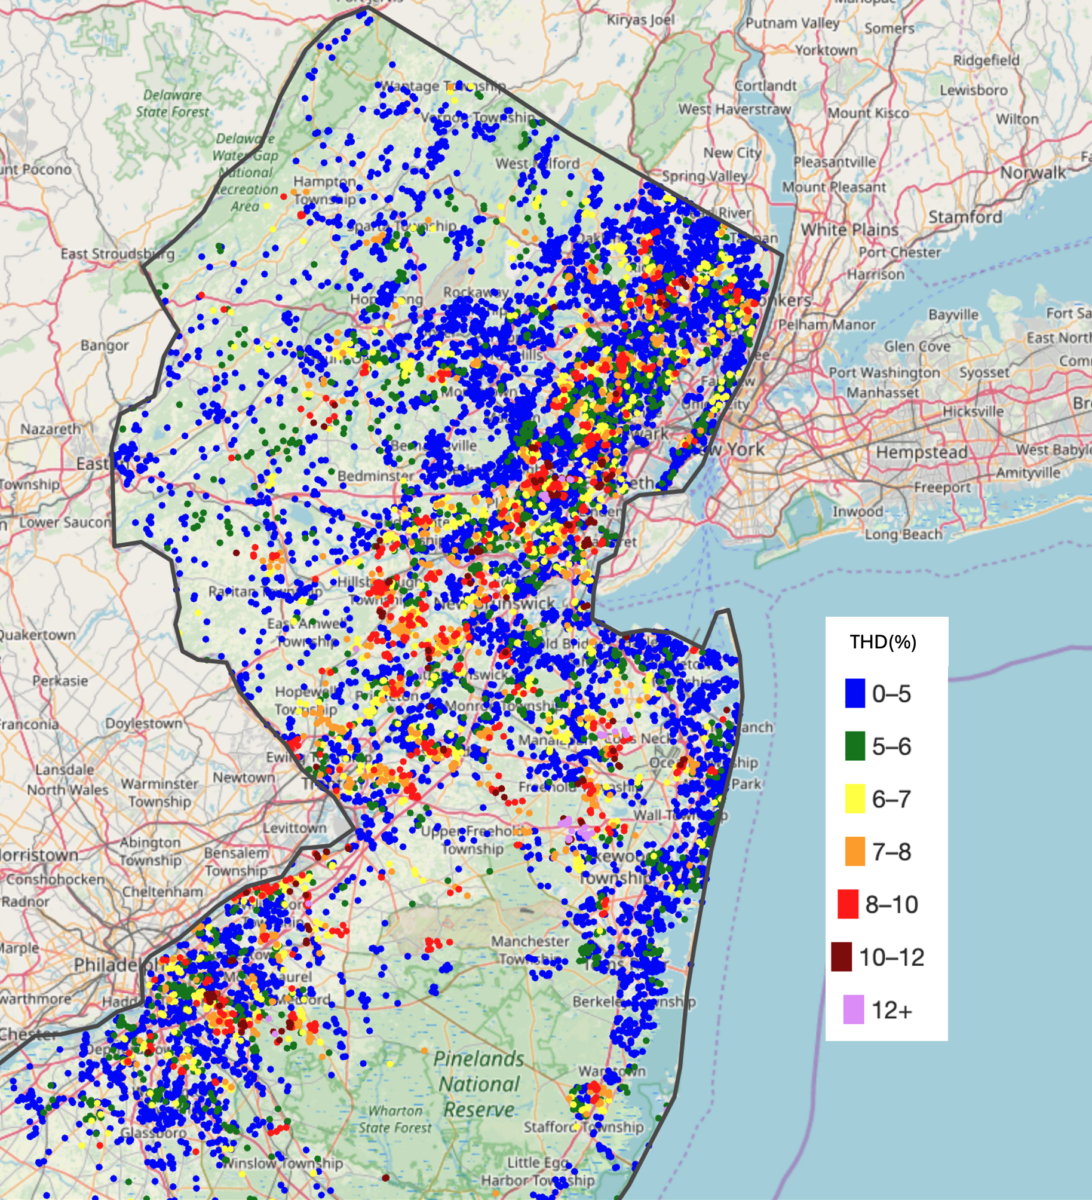
Figure 10 – Sensors in New Jersey, THD October 2024.
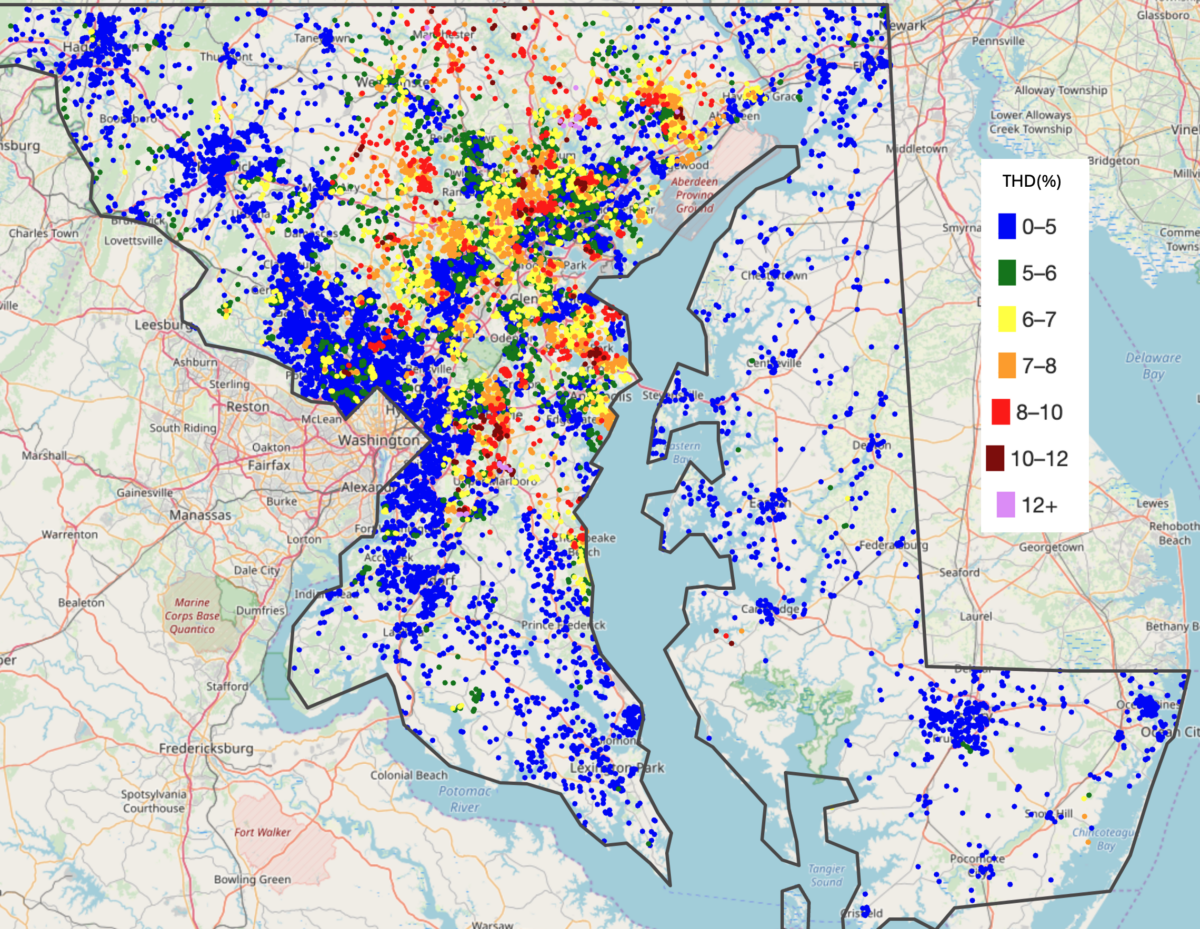
Figure 11 – Sensors in Maryland, THD October 2024.
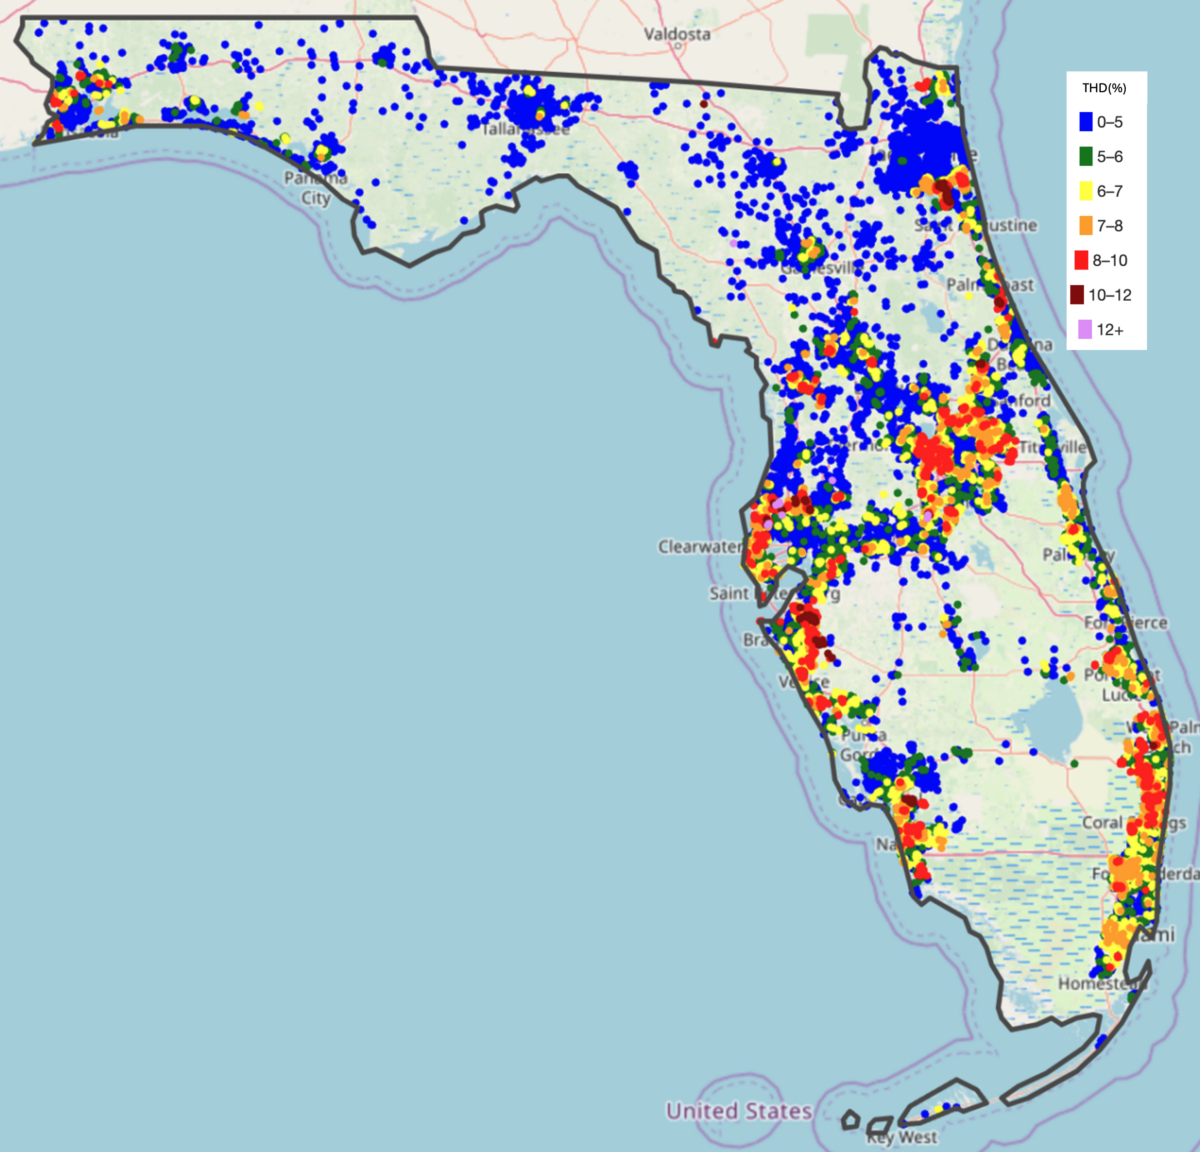
Figure 12 – Sensors in Florida, THD October 2024.
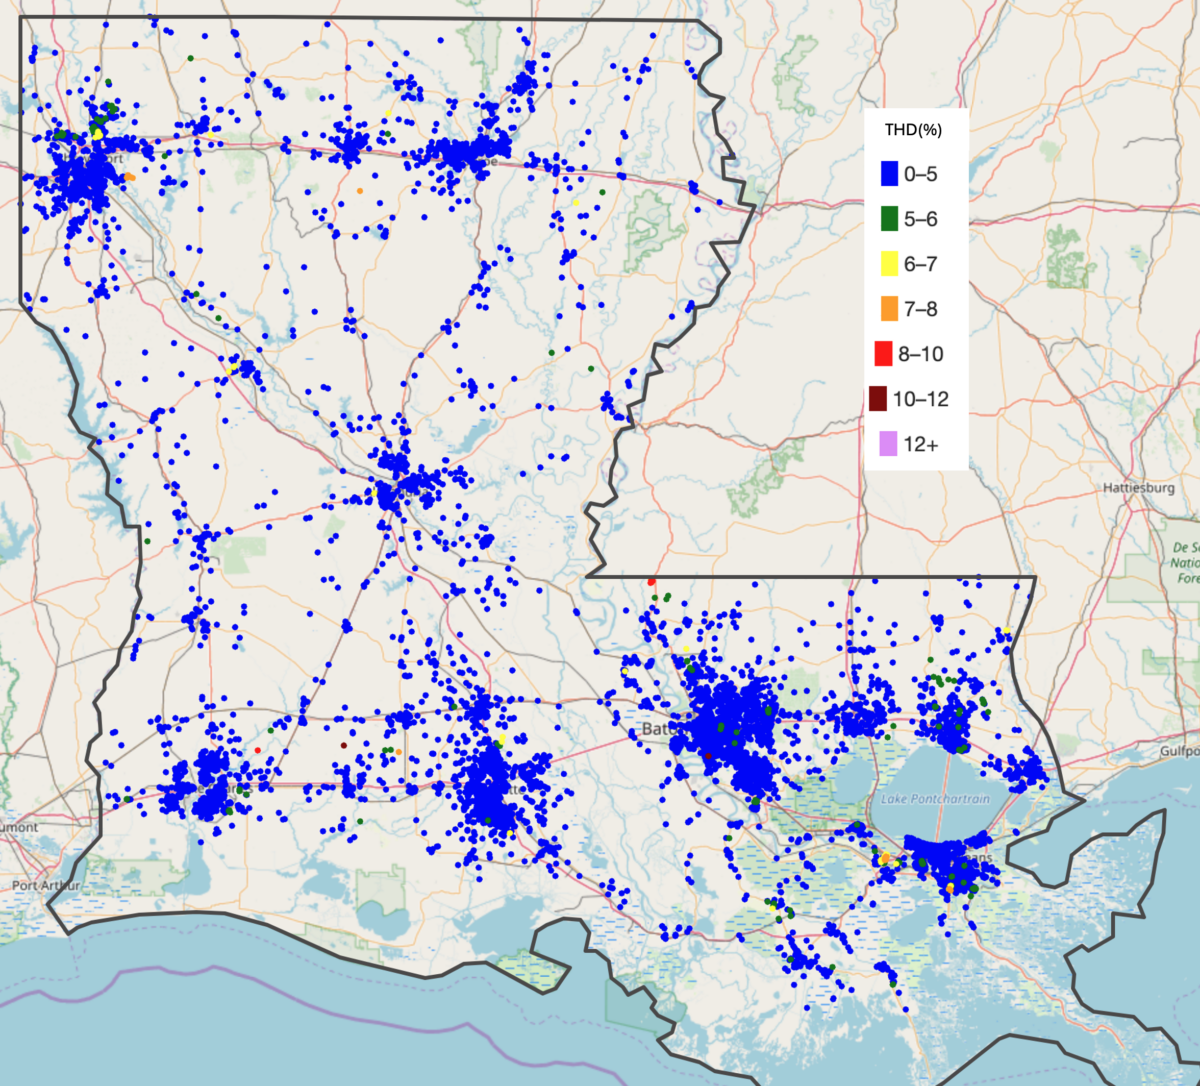
Figure 13 – Sensors in Louisiana, THD October 2024.
By grouping sensors together by utility, we can begin to understand the relationship between utility operators and THD levels on the respective grids. The map below (figure 14) shows the percentage of homes that have THD which exceeds the IEEE 519-2022 limit of 8% by utility.
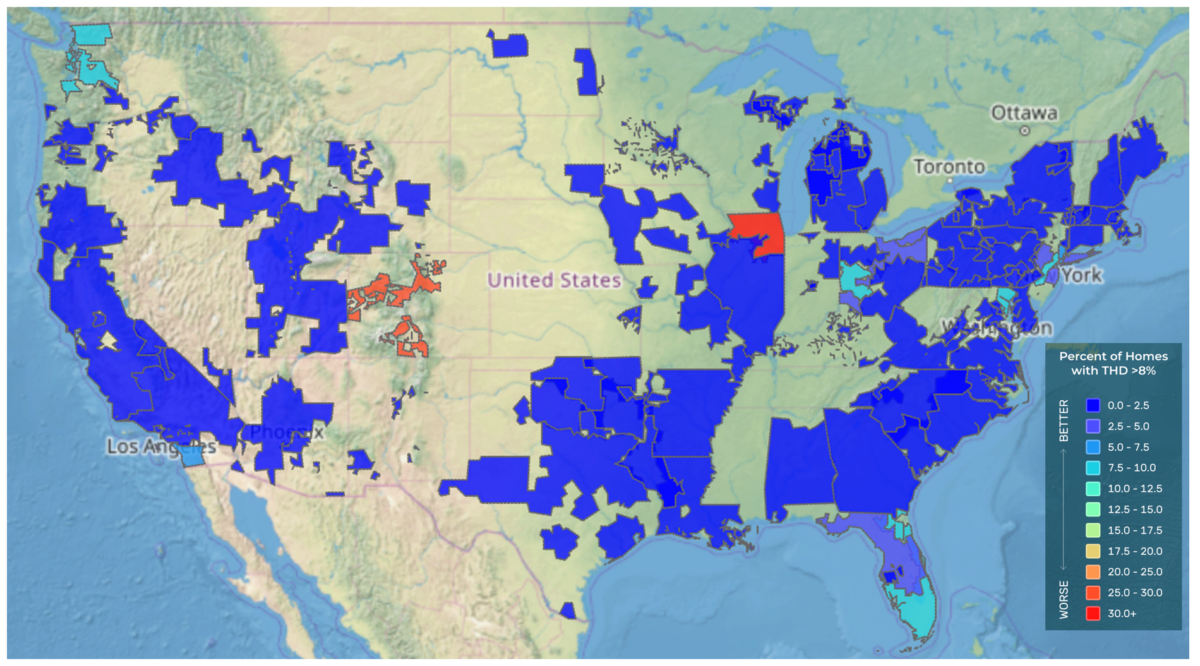
Figure 14 – Percent of Homes with THD > 8%
Prior to IEEE Std 519-2022, the acceptable limit of Total Harmonic Distortion (THD) was limited to less than 5% for bus voltages at the PCC less than 1kV. The table below presents a comparison of the percent of homes that exceed the limits before and after the update of the IEEE Std 519 in 2022. The THD limits were changed from 5% to 8% to acknowledge the growing presence of renewable energy sources and their unique harmonic contributions. Even with the relaxing of these limits there are a significant percentage of homes in each utility area that exceed the current limits. However, the vast majority of utilities would meet the prior IEEE 519 limit of 5%.
Table 1 – Utilities with Highest Percentage of THD Exceeding Acceptable Limits, (averages from Feb. to Oct. 2024)
Figure 15 shows a monthly trend of the percentage of homes that have more than 8% THD for each of the utilities in Table 1 since February of 2024 when the network began recording THD. In the worst case, Commonwealth Edison, 38% of the homes have more than 8% THD. The graph shows that there is some seasonal variability in the THD although even in the best months the number of homes in Commonwealth Edison with abnormally high THD exceeds 27%.
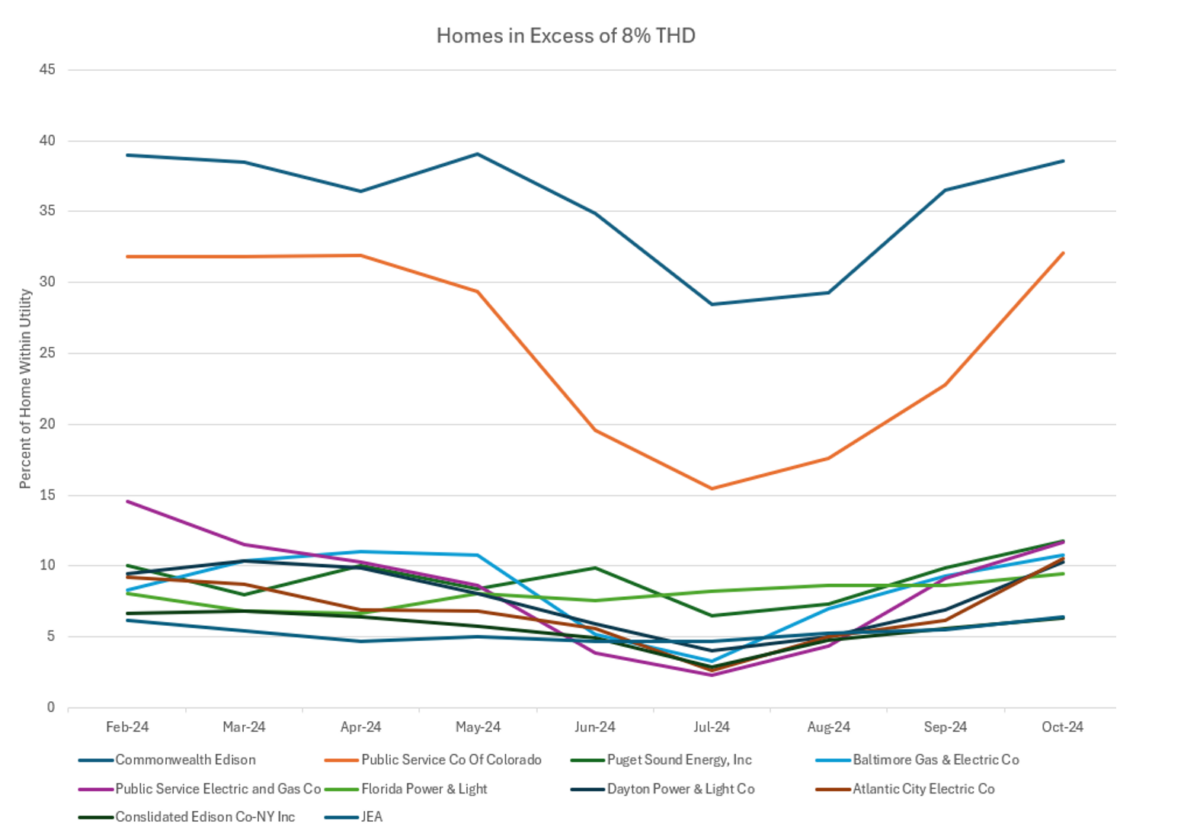
Figure 15 – Monthly THD Trends by Utility
The graph below shows how many homes fall into each percentage of THD for the month of October 2024. The right axis shows the count for all sensors in the network and is indicated by the thicker bar graph. The left axis shows the counts for each of the utilities in Table 1 and the bar graphs are colored according to the legend. It is interesting to note that THD levels for ComEd fall off at a rate like other utilities until about 9-10% where the number of sensors starts to grow again. Although Public Service Co of Colorado has a large percentage of sensors with THD > 8%, their counts fall off at a consistent rate.
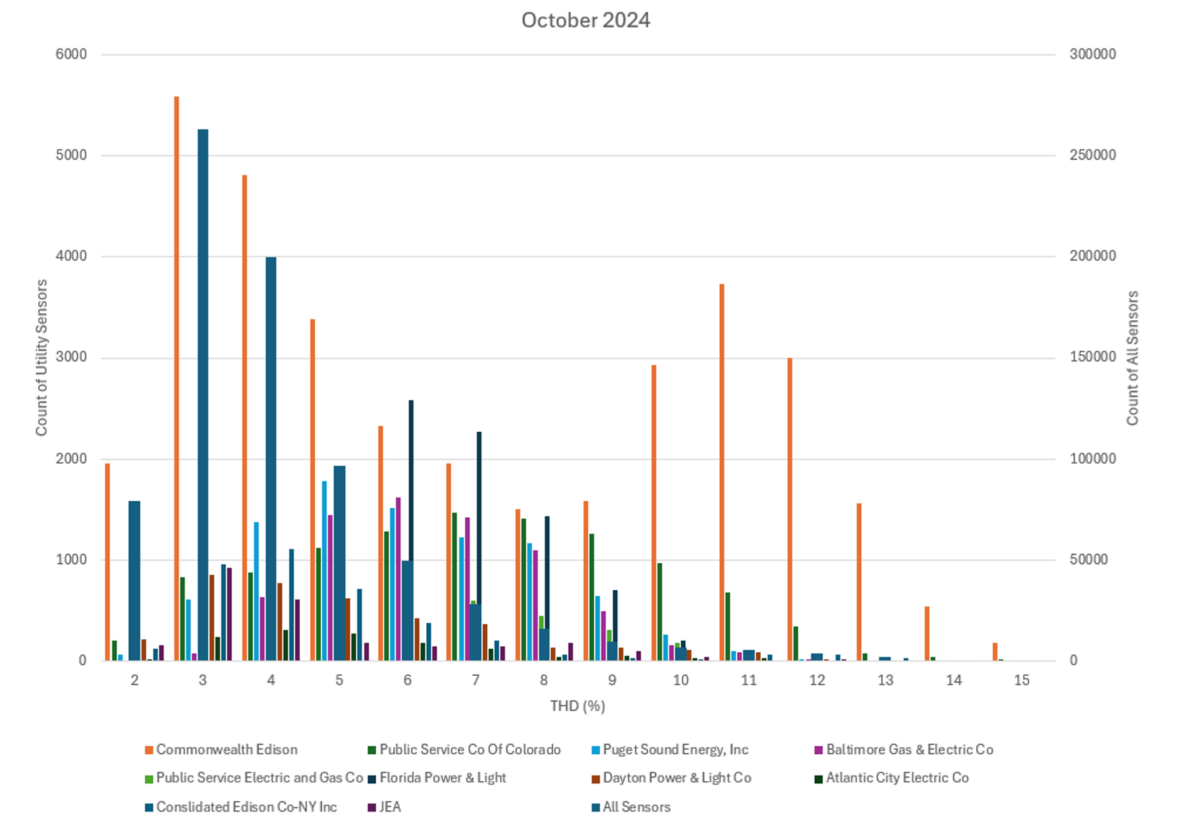
Figure 16 – October 2024 THD Data by Utility
THD Induced by Solar Storms
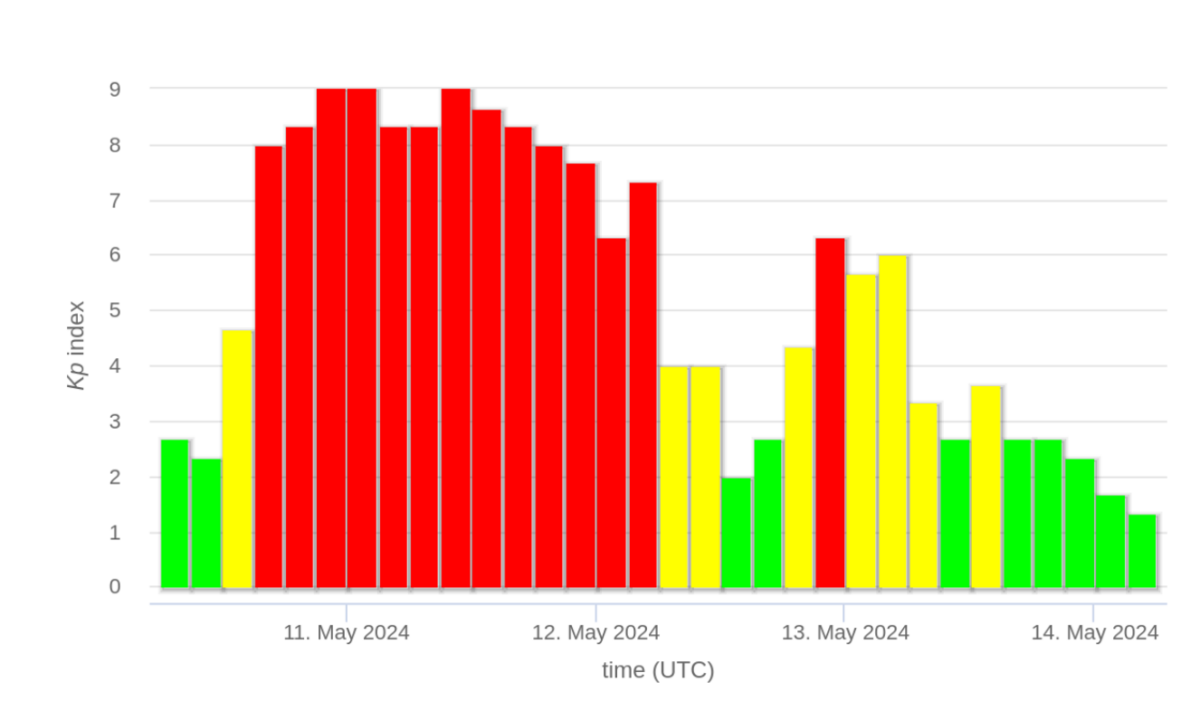
Figure 17 – Kp Index During Solar Storm in May 2024
Harmonics are a normal phenomenon on the grid. Excessive THD (above 8%) is not normal. Occasionally, the grid will experience higher levels of THD due to external forces. For example, in May of 2024, NOAA measured a Coronal Mass Ejection (CME) [6] that interacted with the Earth’s magnetosphere. Figure 17 shows the Kp index (a scale used to measure the geomagnetic activity in the Earth’s atmosphere) during a four-day period [7]. For approximately two days the Kp index was more than seven which is classified by the North American Electric Reliability Corporation (NERC) as a significant event. These events have the potential to disrupt satellite communications and impact the operation of the power grid. Geomagnetic Induced Currents (GICs) are generated during solar storms which flow into transformers, potentially overheating or damaging them. These induced currents can also create voltage instability leading to possible system failures or blackouts. Numerous academic papers explore both the risks and the mitigation strategies for minimizing the impact of solar storms on the power grid.
At the same time as NOAA measured high Kp indices, the Ting sensor network measured elevated THD across seven northern states: Arkansas, Maine, Minnesota, New York, and Washington. The figure below shows the THD trends for a subset of sensors. Conspicuously, the THD measurements during the solar event were extremely elevated, even higher than the IEEE 519 standard of 8%. During the storm, some locations experienced as high as 25% THD.

Figure 18 – THD Measurements During Solar Storm
The most interesting observation was that the solar storm impacted the grid in a series of intense waves that impacted different geographical areas as the waves swept across the US. Figures 19 through 24 capture the time and geographic impact of the May solar storm as it swept across the US. Note that each map represents the increase in THD at each sensor over its baseline THD prior to the storm arrival, and not the actual THD values. This allows for removing of the baseline THD which varies across the US. While not the focus of this paper, data also indicate that solar storm THD impacts are also highly localized at sub distribution grid scales, counter to most accepted theory that GMD events essentially impact the grid a transmission scales.
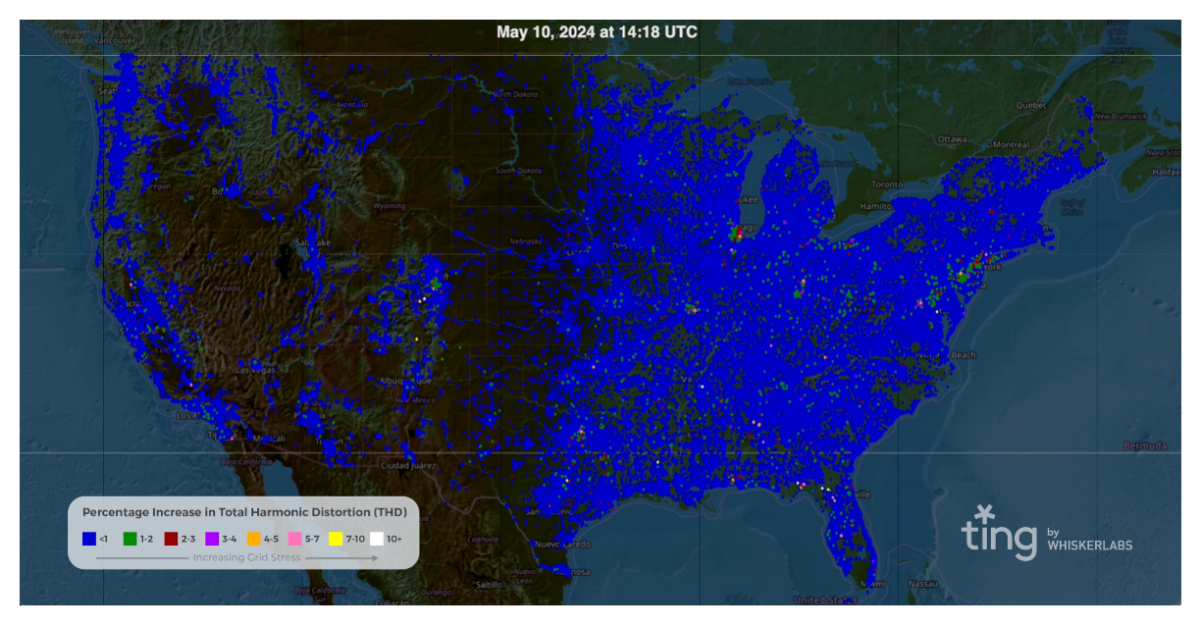
Figure 19 – Baseline THD prior to May 10 Solar Storm
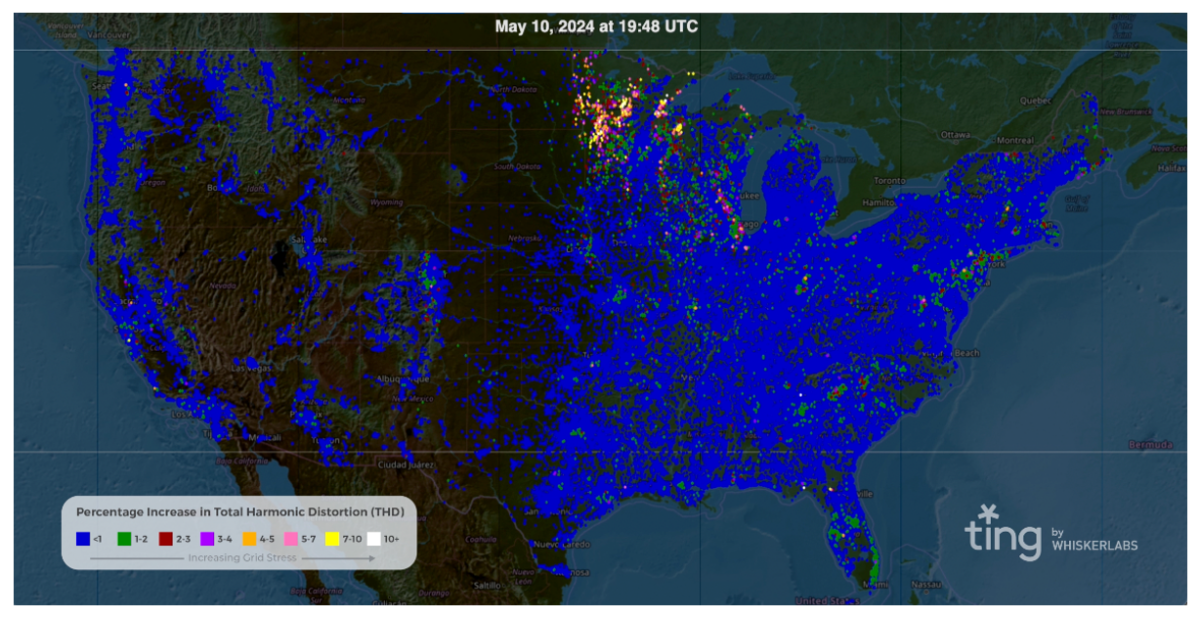
Figure 20 – Solar Storm Impact 5/10/2024 19:48 UTC
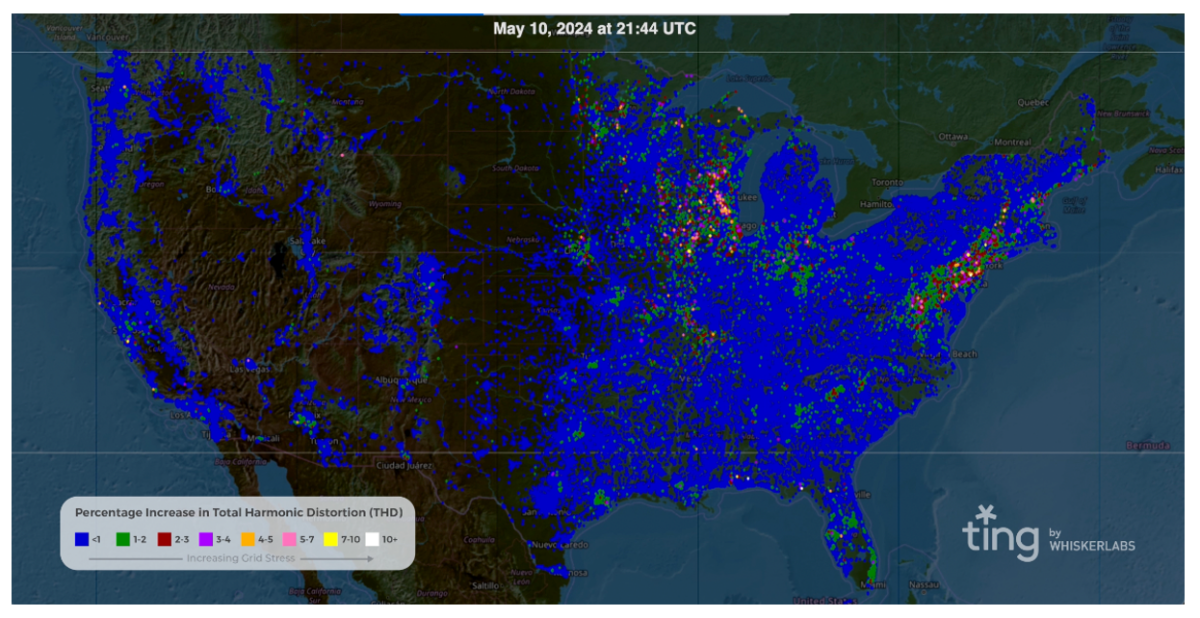
Figure 21- Solar Storm Impact 5/10/2024 21:44 UTC
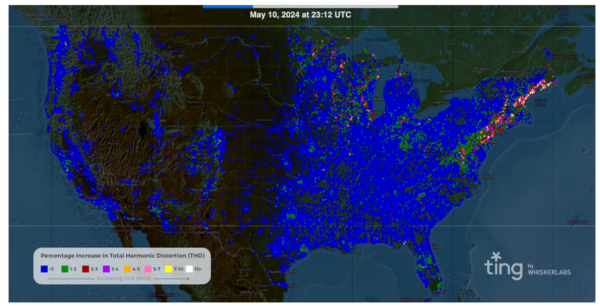
Figure 22- Solar Storm Impact 5/10/2024 23:12 UTC
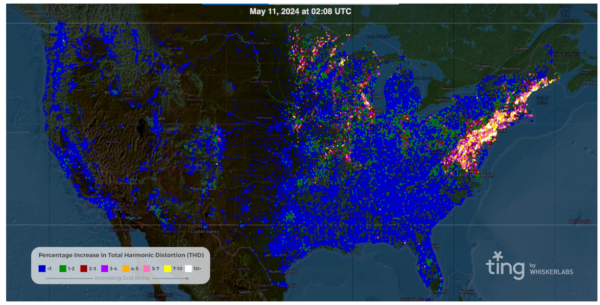
Figure 23 – Solar Storm Impact 5/11/2024 02:08 UTC
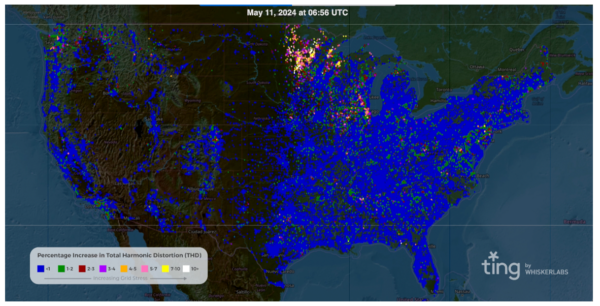
Figure 24 – Solar Storm Impact 5/11/2024 06:56 UTC
While no significant outages were reported during the storm, the data shows that the grid was significantly influenced by space weather. Several sensors were enabled with waveform recording to better understand the harmonic data composition. Figure 25 shows the waveforms from several of the sensors overlapped. The dashed line represents a perfect 60Hz sine wave with the other lines showing the readings from multiple sensors which show large distortions to the normal sine wave.
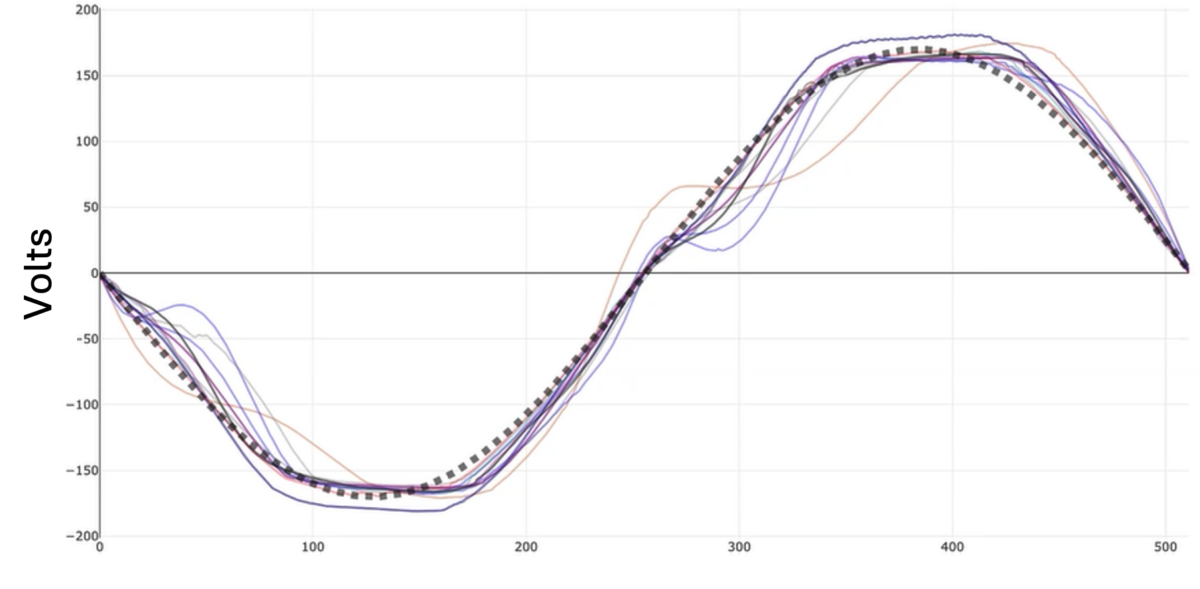
Figure 25 – Waveform Data
A Fast Fourier Transform (FFT) of the waveforms had elevated levels of harmonic spectra, particularly below the 13th harmonic. Figure 26 shows the FFT for one of the waveforms above. Most power systems have naturally occurring odd harmonics (3rd, 5th, and 7th). However, these values were elevated during the storm. In addition, most power systems do not typically have even harmonics. The 4th, 6th, and 8th harmonics were also elevated during the storm.
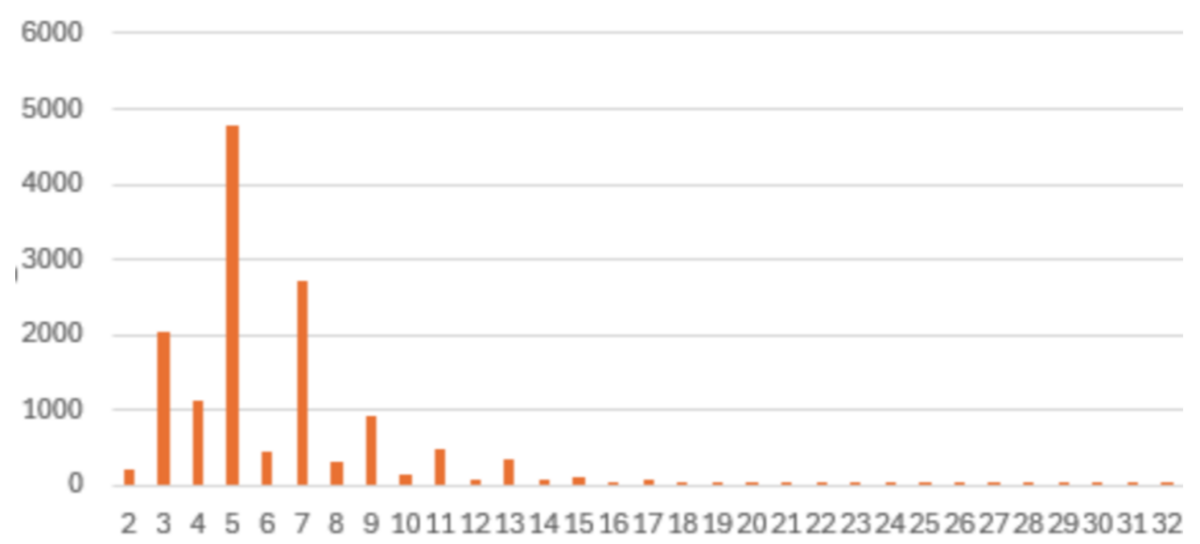
Figure 26 – Harmonic Components
Conclusion
As the U.S. electric grid evolves to include more renewable energy sources and modernized grid components, it faces increased complexity and new challenges in maintaining power quality. Total Harmonic Distortion (THD), a measure of total voltage harmonics found within an electrical system, has become a critical metric for evaluating power quality, as excessive THD reduces the efficiency and lifespan of electrical equipment, leading to increased costs and reliability issues for consumers and utility companies. This paper examines the small-scale distribution of THD, utilizing data collected from Whisker Labs’ Ting Sensor Network. With 1,000,000 sensors across the U.S., Ting provides unprecedented insights into power quality at a granular, local level, enabling the identification of THD hotspots and trends. The findings highlight that while most areas maintain THD within IEEE 519 standards, some utility regions—often densely populated or with specific grid characteristics—experience elevated THD levels. Additionally, events such as solar storms can temporarily spike THD, underscoring the importance of continuous monitoring. The Ting network shows that harmonic-related power quality is good in most of the US. However, some locations have power quality that is considerably worse than IEEE-519 requirements and as a result experience lower energy efficiency and equipment that ages faster and costs more.
The average power consumer in the US is not aware of what THD is or the impact of high THD on devices and appliances in their homes. As consumers become more electrified, depending on electricity to power more aspects of their daily life, it is important that they are aware of these types of measurements and the impact it has on them personally and on their communities. Making these measurements more widely available and understandable creates a win-win situation for consumers and utilities.
Bibliography
[1] Anderson, J., Heckman, S., Laughner, T., & Marshall, B. (2024). Observed Effects of Geomagnetic Disturbances from Wide Area Monitoring System. PACWorld Americas Conference. Raleigh, NC.
[2] IEEE. (2022). IEEE Recommended Practices and Requirements for Harmonic Control in Electrical Power Systems. New York, NY: The Institute of Electrical and Electronics Engineers, Inc.
[3] IEEE Power and Energy Society. (2018). IEEE Guide for Identifying and Improving Voltage Quality in Power Systems. New York, NY: The Institute of Electrical and Electronics Engineers, Inc.
[4] Laughner, T., Sperling, E., & Gegier, F. (2018). Wideband Voltage Sensors For the Modern Substation. CIGRE US National Committee Grid of the Future Symposium. US.
[5] Mueller, D., Ramos, R., McVey, M., & Murphy, A. (2019). Impact of Inverter-Based Photovoltaic Generation on Power Quality on T&D Network in the Southeastern Region of the US. IEEE Power and Energy Society General Meeting. Atlanta, GA.
[6] NOAA. (n.d.). Coronal Mass Ejections. (NOAA) Retrieved 07 05, 2024, from https://www.swpc.noaa.gov/phenomena/coronal-mass-ejections
[7] Wikipedia. (2024, 07 04). May 2024 solar storms. (Wikipedia) Retrieved 07 06, 2024, from https://en.wikipedia.org/wiki/May_2024_solar_storms
[8] Wikipedia. (2024, 06 22). Solar cycle. (Wikipedia) Retrieved 07 05, 2024, from https://en.wikipedia.org/wiki/Solar_cycle