This paper summarizes case data from a smart home electrical monitoring service designed to prevent electrical fires leveraging artificial intelligence (AI) techniques and a proprietary plug-in sensor. This is a follow-on to the inaugural analysis of case data for the system dated March 1, 2022, which analyzed nearly 1,000 documented cases involving 100,000 homes and 65,000 home years of monitoring.[i] In this paper, we expand on that analysis, covering over 4,100 documented cases involving 265,000 homes across the United States over 280,000 home-years of monitoring. We summarize the system’s electrical fire prevention efficiency and associated hazard mitigation data, which encompasses electrical hazards identified by the system in home wiring, devices, and appliances, as well as those introduced into the home from local electrical utility infrastructure issues.
Authors: Vyto Babrauskas, Casey Grant, Stan Heckman, Theo Laughner, Joe McNulty, Michael S. Roy, Christopher Sloop
Introduction
To date, the home electrical monitoring service[ii] we analyzed is active in 265,000 homes and has accumulated over 280,000 home years of data, expanding on a statistically significant foundation for performance analysis data for preventing electrical fires. This paper documents an update to the service’s Electrical Fire Prevention Efficiency (EFPE) and summarizes key metadata associated with more than 4,100 cases where electrical fire hazards in customer homes were identified, localized, confirmed, and mitigated. For a description of the system’s detection and localization features, please refer to the prior paper from March 2022 (see endnote [i]).
Performance Analysis
Electrical Fire Prevention Efficiency (EFPE). EFPE is defined herein as the ability of the system to prevent the full universe of what is generally classified as fires involving ignition from an electrical source. However, data collection on residential electrical fires is generally independent and incomplete.[iii] Consequently, we begin with our estimate of 50,000 annual electrical fires and 120M million dwelling units; this translates to an incident rate of one fire in 2,400 dwelling units (from now on referred to as ‘homes’) annually.[iv]
Figure 1 charts the expected distribution of electrical fires based on this incident rate. With just over 280,000 monitoring years, we would expect approximately 117 electrical fires across all homes with the service (280,181 home years / 2,400 homes = 116.74 fires). However, only twenty-one electrical fires were reported.[v]
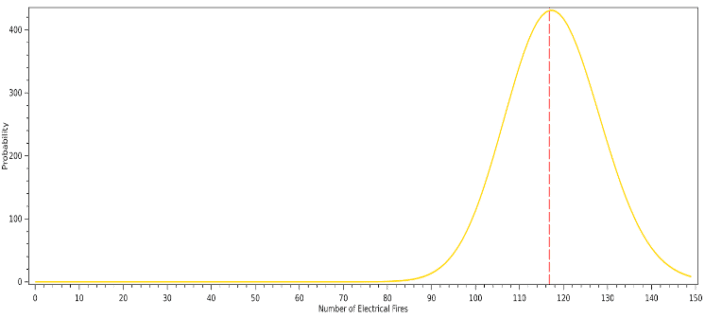
Figure 1 – Probability Distribution, Expected Electrical Fires,
Fire Incident Rate Assumption of 1 in 2,400 Homes
Next, in Figure 2 below, we calculate the probability curve of the system’s current EFPE. We begin with a ‘prior’ assumption that all prevention efficiencies between 0% and 100% were equally likely, meaning there is no prior assumption that the system prevents electrical fires. The chart shows that after observing twenty-one electrical fires in 280,000 home-years of monitoring, there is 80% probability that the system’s EFPE is greater than 77.8%, and a 70% probability that the EFPE is greater than 79.12%.
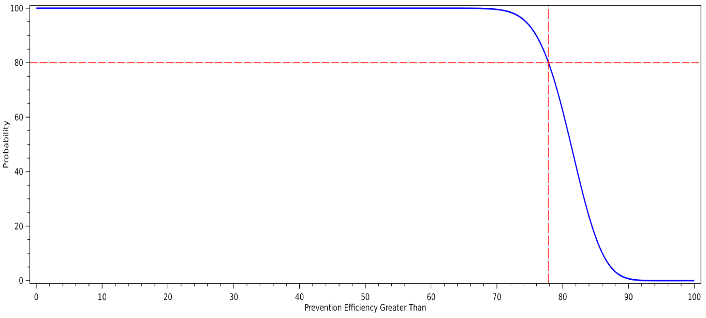
Figure 2 – Prevention Efficiency. If one electrical fire occurs every 2,400 home years, then the probability of N fires in M home years is Poisson(M/2,400, N). If the system prevents some fraction Q of those fires, the probability of N fires in M home years is Poisson(MQ/2,400, N). To estimate prevention efficiency Q, apply Bayes’ theorem; observation of N fires in M home years modifies our prior probability distribution for Q by a factor of Poisson(MQ/2400, N). As a prior, we assume all prevention efficiencies from 0% to 100% are equally likely.
The data indicate that the system continues to prevent a significant majority of electrical fires. As a learning system, each potential electrical fire prevented – or each fire experienced by a home where the system is installed – generates additional input into the system’s machine-learning algorithms.
It is important to note that the system is not currently designed nor expected to prevent all electrical fires. There are two primary classes of electrical fire causation events for which the system is not currently designed to detect, alert and mitigate:
- Immediate and catastrophic failures. Some electrical failures that cause electrical fires can occur immediately and catastrophically. The system is designed to detect low-level, incipient arcing events that develop slowly over extended periods (hours, days, and weeks typically) that can progress in severity to produce ignition. While the system does “see” immediate and catastrophic failures, it is not designed to alert on these failures.
- Glowing connections that do not produce arcing. It is known that loose conductors can produce high resistance, “glowing” connections that produce high heat sufficient to ignite fires. The conditions do not necessarily generate arcing that the system is designed to detect. Our experience suggests that many of these conditions generate periodic arcing that the system detects. Many of the hazards detected, localized, and mitigated were high resistance connections that were or had produced high heat glowing conditions. However, this specific condition does not always produce sufficient signals for the system to detect and mitigate.
Hazard Analysis
More than 4,100 cases – or hazard detection and mitigation events – have been documented at the time of this paper. Each case is an event where the system detected, localized, identified, and mitigated an otherwise hidden hazard before the potential ignition of an electrical fire. We explore the data associated with these further below.
Definitions. For this paper, we classify potential electrical fire hazards that can lead to a fire in the home as either an Electrical Fire Hazard (EFH, generally a cause found in the home) or a Utility Fire Hazard (UFH, causes related to electric utility infrastructure).
EFH: Electrical fire hazards in homeowner devices, appliances, home systems, and
home electrical infrastructure
UFH: Electrical fire hazards introduced into the home by electric utility infrastructure
EFHs correlate directly to what are generally considered traditional ignition sources for home fires. Typical hazards include, but are not limited to, loose wiring connections; damaged or compromised wiring insulation; faulty panels or circuit breakers; and faulty devices/appliances, such as water heaters, sump pumps, radon pumps, heating pads, or power supplies. A hazard must have been first found by the system to be included in these figures. In every case, it is confirmed that remediation of a given hazard ‘removes’ the signals detected by the system, proving that a specific device or infrastructure was the source of the signal. In most cases, the faulty wiring or device that was the source of the hazard signal shows physical evidence that indicates a fire hazard, too. Typical physical evidence includes charred wires, melted or charred plastic, wet tracking, or other evidence confirming that the device is unsafe.
Separately, UFHs represent a subset of issues related to grid infrastructure not documented to any level of detail until now. More specifically, we define UFHs as electrical fire hazards introduced into the home by ‘last mile distribution’, or electric utility infrastructure proximal to the home. Typical UFHs include a loose neutral or loose hot at the meter, weatherhead, service line, or transformer, sustained high or low base voltage, overloaded or faulty transformer, and grid arcing.
An important distinction is required here: the hazards detected and documented by the system in this paper – UFHs – do not include the full spectrum of grid faults that have been studied separately at length by other parties. For example, the Electric Power Research Institute (EPRI) described a number of different hazards by voltage level (distribution through transmission) and region of the country.[vi] That research revealed that equipment failure comprises the largest reason for voltage sags on the utility grid. However, lightning, vegetation, and animal contact are also frequent causes of utility failures. The system provides a network effect as sensor density increases in a given geographic region. Consequently, many of these grid faults are detected by the home-based sensor network; however, these faults and the system responses to them are not in scope for this paper.
Hazard Frequency in System-Monitored Homes. The data shows that EFHs occur more frequently than UFHs. The system has detected EFHs in 1 in 123 homes per year and UFHs in 1 in 154 homes per year. The combined annual rate across the above classifications – meaning the combined rate of EFHs and UFHs identified, certified, and mitigated – is 1 in 68 homes per year (Figure 3). In very few cases have the signals been associated with something manifestly safe; in almost every case, a troublesome-looking electrical problem was discovered, and when that problem was corrected, the hazardous signals documented by the system disappeared. The system has a false alarm rate of 0.01%, with 27 false positive cases spanning over 281,000 home years.
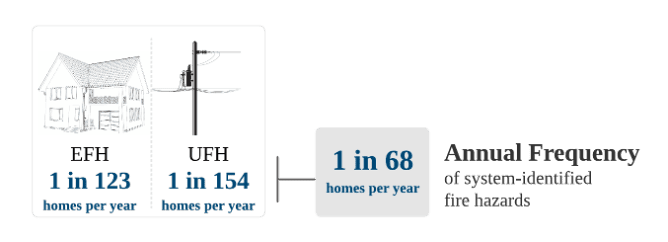
Figure 3 – System Metrics: Annualized Frequency of System-Identified Electrical Fire Hazards and Utility Fire Hazards
EFHs – Electrical Fire Hazards
As expected, 92% of EFHs identified by the system were due to some form of hazardous electrical arcing (Figure 4). The balance of EFHs includes loose neutrals (4.9%), high resistance (H/R) wiring/connections (0.6%, green slice, not labeled), or glowing connections (0.4%, orange slice, not labeled).
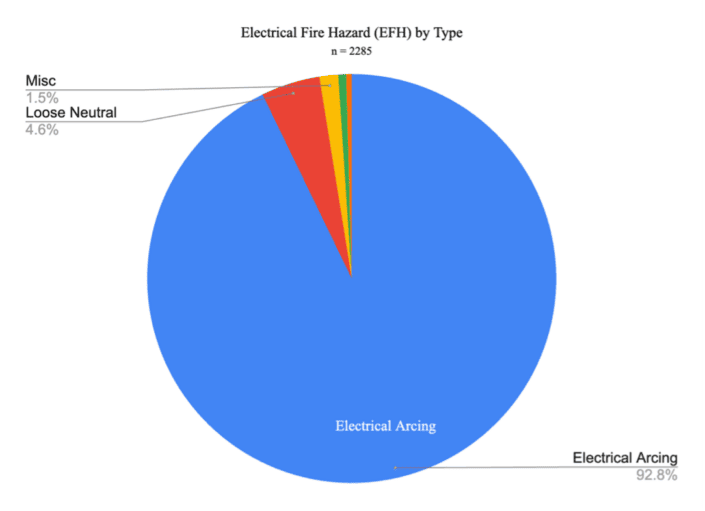
Figure 4 – Electrical Fire Hazards (EFHs) by Type
Of all EFHs, approximately one-half, or 50%, were device/appliance-related. The remainder of the hazards were from home infrastructure (wiring, outlets, switches, breakers, and panels). According to industry reporting of fire estimates, 39% of reported fires due to Electrical Failure or Malfunction stem from wiring and related equipment; however, these fires caused a disproportionate amount of losses at 46% of all losses.[vii] Everything but Device/Appliance can be considered “Home Electrical Infrastructure” in Figure 5 below.
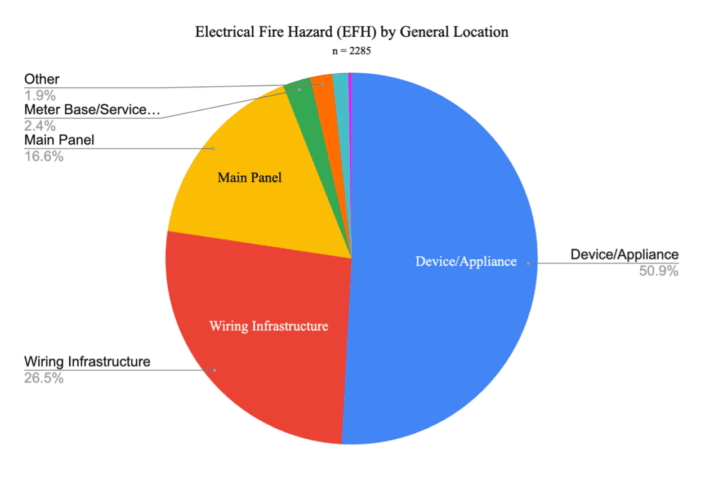
Figure 5 – General Location of EFHs
Figure 6 depicts EFH identification by room/area. Note the ‘location’ for portable devices and electronics, such as electric blankets and laptop chargers, is classified as ‘Other.’
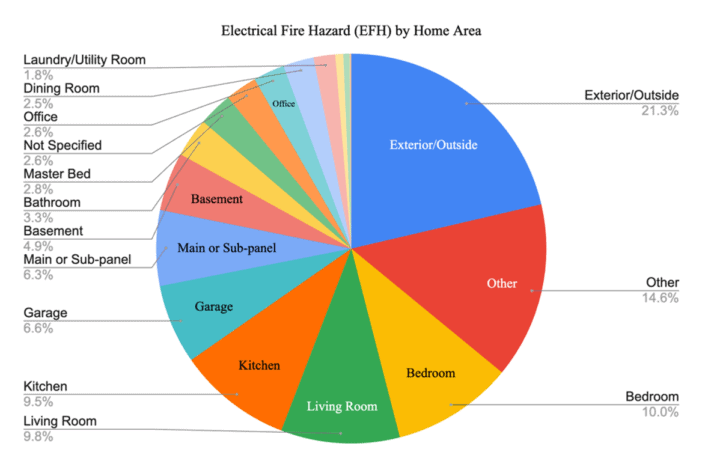
Figure 6 – Relative Location of EFHs within the Home[viii]
Because of the fundamental differences in home electrical infrastructure and what is either hard-wired or plugged into it, we further break out EFHs below: Electrical fire hazards in homeowner devices, appliances, and home systems, versus those found in home electrical infrastructure (wiring, outlets, switches, breakers, and panels).
EFH – Electrical Fire Hazards in Devices, Appliances, and Home Systems[x]. These hazards are separate and distinct from those associated with a home’s existing electrical infrastructure. Importantly, the data reveals that home age is not a leading determinant of electrical fire risk where devices, appliances, or home systems are the hazard source. Figure 7 shows frequency by type of device.
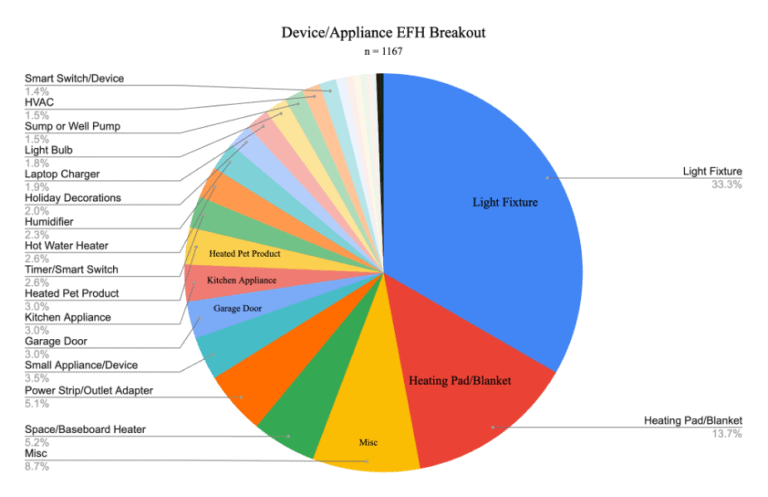
Figure 7 – Electrical Fire Hazards (EFHs) from Devices & Appliances[xi]
EFH – Electrical Fire Hazards from Home Electrical Infrastructure. These hazards include those associated with a home’s existing electrical infrastructure, where electrical system components are generally hidden from everyday view. Such components include wiring inside walls and above ceilings, electrical outlets, wall switches, electrical panels (either the panel itself or circuit breakers enclosed inside the panel), and the meter base. The data supports the fact that outlets represent of the majority of these hazards. Figure 8 provides a breakdown by hazard location.
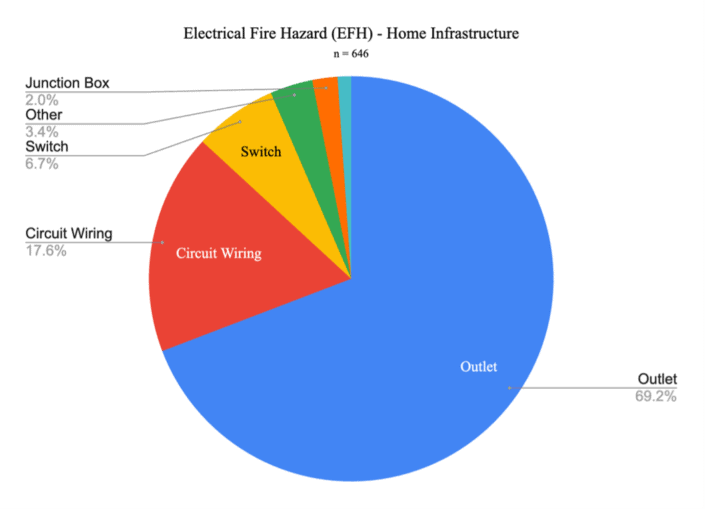
Figure 8 – Electrical Fire Hazards (EFHs) in Home Electrical Infrastructure[xii]
UFH – Home Electrical Fire Hazards from Electric Utility Infrastructure
These events are sustained hazards associated with the electric utility’s local distribution infrastructure, including distribution transformers, meters, and respective connections. It is important to note that the system provides real-time, continuous monitoring of utility power quality and provides notifications to customers of short-term power quality events, such as surges, brownouts, and outages. In contrast to the sustained hazards that form the UFHs identified by the system, short-term events are often caused by weather and grid infrastructure faults and are outside the scope of this paper.
UFHs detected and identified by the system are typically the result of one or more of the following:
- loose/poor neutral connections
- loose/poor hot connections
- sustained high voltage (overvoltage)[xiii]
- sustained low voltage (undervoltage)
- failing/overloaded transformers
- grid arcing
Figure 9 provides a breakdown of these hazards. Note that loose or open neutral conditions can exist on the homeowner’s side or utility side of the meter. However, the system documents that nearly 95% of these conditions exist on utility-controlled infrastructure.
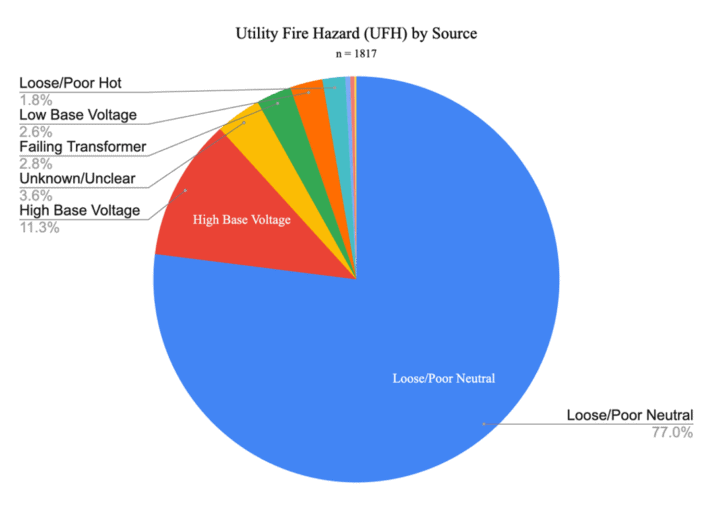
Figure 9 – Utility Fire Hazards (UFHs) [xiv]
- an electrical fire in the home,
- damage or destruction of devices and appliances in the home,
- electrocution risk, and
- a wildfire ignition threat (in arid climates).
The system does not prevent power quality issues; however, it demonstrates the ability to detect conditions leading to power quality concerns, such as voltage fluctuations, various maintenance-related issues, weather and utility disturbances, and high concentrations of electronic equipment. These detection capabilities can play a key role in preventing or mitigating equipment and property loss. However, this topic is outside the scope of this paper. The full impact of equipment and property loss in the residential segment due to these issues has yet to be fully explored, yet, a look at claims data for small and medium businesses provides us insight into how important power quality issues can be no matter the structure in question: according to one program, nearly 45% of claims are related to a power quality issue.[xv]
Hazards Relative to Home Age
EFHs and Home Age
A review of the first two columns on the left in Figure 10 indicates that ~87% of all EFHs occurred in homes greater than 20 years old. Approximately 80% of all homes in the U.S. are greater than 20 years old.[xvi] This seems to suggest that detected EFHs, in general, skew slightly to older homes. A study of hazard cases relative to the age distribution for the entire population of system-protected homes is outside the scope of this paper.[xvii]
Notwithstanding this, we observe some interesting data when EFHs are further segmented into devices/appliances and home infrastructure segments.
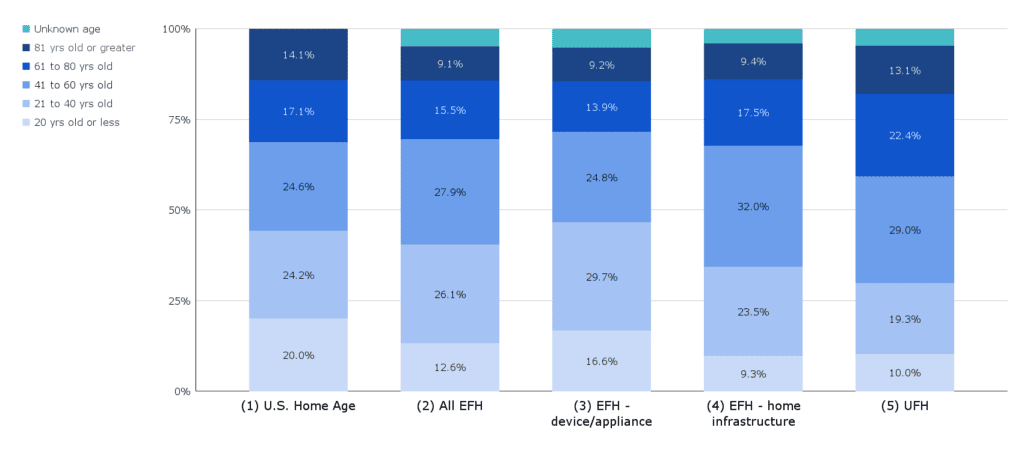
Figure 10 – Overall Hazard Distribution by Home Age
EFHs from home infrastructure. In general, older homes are at higher risk of experiencing an electrical fire from aging infrastructure. With well over a century of residential electrification in many cities and towns, the aging of the residential electrical infrastructure remains a concern within the electrical and firefighting communities.[xviii] Besides the natural effects that age can have on wire insulation and electrical equipment over time, residential electrical systems are seldom inspected after their original installation. In addition, the quality of the original installation may be a factor, as well as inappropriate upgrades or additions that unqualified homeowners or others may have done throughout the years.
Specifically, we find that when isolating EFHs related to home infrastructure – effectively removing those attributed to devices/appliances – EFHs skew more towards older homes (compare column 1 to column 4 of Figure 10). This finding is not unexpected. Notably, these hazards skew even more towards homes built in the 1960s and 1970s, as compared to much older homes. This could be related to a number of factors, including renovation cycles, building standards, materials quality, and materials substitution (e.g., aluminum wiring), to name a few.
EFHs from devices/appliances. The above finding also suggests that EFHs due to devices and appliances, in contrast, generally don’t skew as much toward older homes, which can be explained by device and appliance lifecycles being far shorter than that of a home. While ~20% of U.S. homes are less than 20 years old, ~16.6% of device and appliance hazards occurred in homes less than 20 years old. Similarly, ~44% of U.S. homes are less than 40 years old, but ~46% of these device/appliance hazards reside in homes 40 years or less in age.
UFHs and Home Age
Data suggest that UFH hazards skew towards older homes and suggest that older homes in older neighborhoods generally have older or possibly outdated grid infrastructure (compare column 1 to column 5 of Figure 10). For example, ~80% of all U.S. homes are more than 20 years old, yet ~90% of UFHs occur in homes more than 20 years old. Similarly, ~56% of U.S. homes are more than 40 years old, but ~72% of UFHs occurred in homes more than 40 years old. This finding may indicate that older homes in older neighborhoods generally have outdated grid infrastructure relative to newer communities, which is not surprising. But, equally important, the data clearly shows that newer homes and communities are not immune to these types of electric utility hazards. This data is useful and can be used to produce community grid resilience scores.
UFHs and Geography. Importantly, as system data accumulates, the statistical significance for UFHs has increased. The system is deployed in homes in every U.S. state, and geographic dependencies are being tracked. Data from the system’s documented UFH cases reveal ‘hot spots’ in the map below in Figure 11. UFHs tend to skew toward older communities and older homes, however, this is not true in all communities. Across the system’s covered homes in the U.S., the data reveal an average of 0.8% of them encountering dangerous power conditions due to UFHs depicted by the mid to dark purple areas in the figure. The ‘brighter’ spots indicate areas where UFH frequency is 3 to 4 times higher than this average.
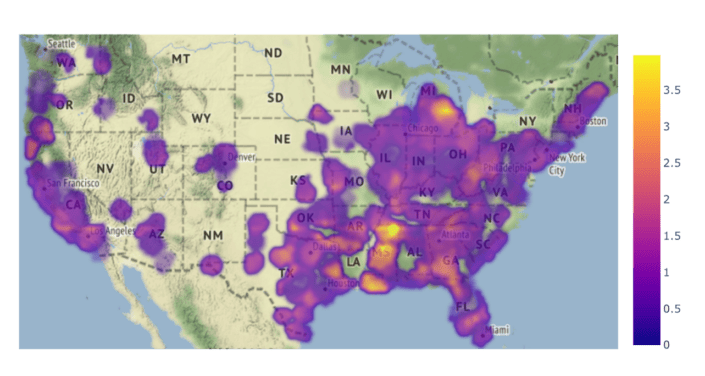
Figure 11– Current Utility Fire Hazard (UFH) Density Map
Calculated by computing UFH density (hazards per 100 home-years) in a 50-mile radius around a map grid.
Conclusions
The data analyzed indicate the system prevents four out of five electrical fires. System and hazard data continue to be novel and informative, representing a significant data source not previously available. The data also demonstrate that the system is virtually free of false alarms and false positives.
The Electrical Fire Problem. With the continued ‘electrification’ of the U.S. and increasing reliance on electricity, a corresponding increase in fire risk can reasonably be expected, placing even greater importance on fire prevention. Notably, the 10-year period from 2012 through 2021 saw a slight reduction in residential fires in the cooking, smoking, and heating categories; however, electrical fires saw an upward trend, with an 11% increase over that same period[xix]. The system has proven to be an effective approach to preventing electrical fire ignitions, and we expect a positive impact on this 10-year trend as the system continues to expand.
Fire Prevention Data. The data relative to hazard discovery, isolation, and remediation continues to hold promise to better inform approaches to electrical fire prevention and analysis – both inside the home and with utility providers. Currently, none of the existing databases for residential fire data have all of the characteristics desired for residential electrical fire data, making it important to leverage the use of the Internet of Things (IoT), cyber-physical systems, wireless sensor technology, artificial intelligence algorithms, smart grid applications, etc. to inform the evaluation of the residential electrical fire problem through future efforts[xx]. The system offers a new large and quickly growing data set that can help inform how fire data might be further analyzed and understood. Importantly, the data resulting from each system hazard case is well-suited to evolve better design, standards, and practices relative to safety and resiliency across several fronts.
System Data for Modeling Risk. The case data presented herein is a proxy for home fires and, in turn, a proxy for home fire risk. Using modern artificial intelligence (AI) techniques, including machine learning (ML), to predict home fire hazards, system data is being used to develop a model that can reasonably predict the electrical fire risk for any home. The model already has skill; half of homes the model thinks will be riskier in fact have twice as many hazard cases as the half of homes the model thinks will be less risky.
Expanded Insights from Case Data. Case data has been expanded to include information such as whether water from plumbing issues was a factor. Cases where leaking hot water heaters, failing sump pumps, leaky valves and pipes, and weather-related moisture infiltration have been documented. In some cases, water pooling around an energized appliance cord or extension cord led to a hazard, in others, arcing in wiring or around outlets and light fixtures have been observed. This feature is an added benefit of the system with respect to home safety and protection. Similarly, case data for the system’s EFHs more recently include whether a form of AFCI technology was present in the home and if the hazard detected was on the same AFCI-protected circuit. As the system expands, we expect these data attributes will become statistically significant for each scenario described above.
Impact on the Grid and its Operators. UFHs and their remediation data improve the grid one home at a time – and in groups of homes or communities – relative to how ‘last-mile distribution’ is configured in a given area. The precision of data from these hazards demonstrates that real-time actionable data at this segment of the grid is valuable to both homeowners and utilities. The benefits extend beyond homeowner and community safety, including fewer utility truck rolls, higher ‘problem found’ rates, and increased situational awareness. The data also reveals fire hazards related to the further electrification of homes and the increased grid complexity from solar deployments, battery systems, and the proliferation of electric vehicles.
Beyond Fire Prevention. The electrical fire hazards identified by the system often include home systems or appliances whose reliable operation is essential for safe conditions in the home. In many cases, they appeared to be operating normally to a casual observer. In others, they were failing, not working all the time, or not operating at all while showing no external signs of an inherent electrical fire hazard. In these situations, the system’s identification of these fire hazards also enabled the homeowner to repair or replace the system or appliance before failure, avoiding unsafe conditions in the home. Examples include radon pumps, sump pumps, water heaters, well pumps, HVAC units, and portable heaters. Similarly, the system has also documented failing sump pumps, water heaters, and arcing due to water from indoor plumbing leaks.
– – –
While the data used to present these findings is statistically significant, data continues to accumulate which will support future expanded analysis. As distribution continues to more homes and additional monitoring years are accumulated, more insights will be gained, allowing expansion upon these findings.
[i] Babrauskas, V.; Grant, C; Heckman, S.; Laughner, T.; McNulty, J.; Roy, M.; Sloop, M., New Data: Electrical Fire Prevention (March 2022), https://www.whiskerlabs.com/services/ting-performance/
[ii] Ting, by Whisker Labs.
[iii] Hutchison, V., Fire Protection Research Foundation; Residential Electrical Fire Problem: The Data Landscape (October 2018)
[iv] Reference endnote [i] for details.
[v] Whisker Labs is made aware of any suspected electrical fires in system-monitored homes. Twenty-one electrical fires were reported during this same period.
[vi] Distribution System Power Quality Assessment: Phase II—Voltage Sag and Interruption Analysis, EPRI, Palo Alto, CA: 2003. 1001678.
[vii] NFPA Home Electrical Fires Supporting Tables, March 2019, Campbell, Richard
[viii] Not labeled in graph due to space limitations: Hallway: 0.7%; Detached Structure: 0.5%; Attic: 0.1%.
[ix] Where electric utility responsibility ends and customer responsibility starts is not universal and can vary by utility and type of structure.
[x] Core built-in systems for the home, examples include heating, air conditioning and ventilation (HVAC), radon mitigation, sump pump, water heating and treatment.
[xi] Small Appliance/Device includes items such as paper shredders, sewing machines, water filters, vacuum cleaners, etc. Not labeled in graph due to space limitations: Extension Cord: 0.8%; Pool Equipment: 0.7%; Fan: 0.6%; Light Socket to Plug Adapter: 0.5%; Phone Charger: 0.4%, Dryer: 0.3%, Radon Pump: 0.3%; Aquarium: 0.3%.
[xii] Not labeled in graph due to space limitations: GFCI Outlet: 1.1%.
[xiii] Overvoltages and undervoltages generally are not the result of system faults; IEEE Std 1159™-2019, IEEE Recommended Practice for Monitoring Electric Power Quality Developed by the Transmission and Distribution Committee, p24.
[xiv] Not labeled in graph due to space limitations: Grid Arcing: 0.4%; Utility Meter – Utility Responsibility, 0.3%; Missing/Damaged Utility Ground, 0.2%.
[xv] Claims data from Hartford Steam Boiler’s (HSB’s) Commercial Equipment Breakdown Insurance program for Small to Medium Enterprise (SME) accounts (O’Shaughnessy, J.).
[xvi] U.S. Census data U.S. Census Bureau (Census), American Housing Survey Data Tables, 2019 National – General Housing Data, total detached and attached home structures.
[xvii] It is not assumed here that the age of homes protected by the system represent the same general distribution as all US homes. Data related to the entire system fleet relative to home age and other attributes is not included in the scope of this paper.
[xviii] Residential Electrical System Aging Research Project Technical Report July 1, 2008, The Fire Protection Research Foundation; prepared by David A. Dini, P.E. Underwriters Laboratories Inc.
[xix] U.S. Fire Administration, Residential Fire Estimate Summaries – Residential building fire trends (2012-2021).
[xx] Hutchison, V., Fire Protection Research Foundation; Residential Electrical Fire Problem: The Data Landscape (October 2018)
© Copyright Whisker Labs 2023