This paper summarizes data from a smart home electrical monitoring service designed to prevent electrical fires. It analyzes the system’s electrical fire prevention efficiency and associated mitigation data, which encompasses electrical hazards in home wiring, devices, and appliances, as well as those introduced into the home from local electrical utility infrastructure issues. Root causes of these hazards and correlation with home age are analyzed.
Authors
Vyto Babrauskas, Casey Grant, Stan Heckman, Theo Laughner, Joe McNulty, Michael S. Roy, Christopher Sloop
Notice. This whitepaper is for information purposes only and may be subject to change without prior notice. It contains references to third-party research, data, and industry publications. No warranty is given to the accuracy and completeness of this third-party information. Neither the third-party information, its inferences nor its assumptions have been independently verified by Whisker Labs.
Background
Electrical fires impact nearly 50,000 homes each year.[1] These fires cause approximately $1.3B in property losses each year and result in thousands of injuries and deaths annually.
To date, the home electrical monitoring service[2] is active in 100,000 homes and has accumulated nearly 65,000 home-years of data, providing a statistically significant foundation for performance analysis data for preventing electrical fires. This paper documents the service’s Electrical Fire Prevention Efficiency (EFPE) and summarizes key metadata associated with more than 1,000 cases where electrical fire hazards in customer homes were identified, localized, identified, confirmed, and mitigated. These data are new and unique to the fire safety community. We expect additional detailed papers as the data set from this system continues to expand.
The Technology
Background. Electricity travels over conductors (“wires”) on the grid, inside the home, up to and inside connected devices and appliances. Electrical fires can occur when a conductor fails to conduct, or an insulator fails to insulate.[3]
Conductors fail to conduct because a joint fractures, the last strand of a cable breaks, or an outlet, ‘push-in’ or other connection or junction on a conductor becomes loose. These conditions often leave conductors with too small a surface area to provide a safe and reliable connection. Consequently, the lack of a quality connection can result in a high resistance connection that produces heat and leads to physical and chemical processes that oxidize the connection, further increasing resistance and heat. Electrical arcing often occurs across these poor connections depending on many factors, including but not limited to physical changes in the connection (temperature), the energy load drawn across the connection, and the changing quality (or lack of quality) of the connection.
Insulators fail where a flexible cord or rigid insulator fractures or pollutants or water infiltrates an intended insulation opening. Fractures may arise from defects in manufacturing, hammer blows during construction, or repeated stress in use. Each time a small electrical failure occurs across one of these fractures, a bit more of the insulator is damaged, (usually) extinguishing the immediate failure but (usually) facilitating future failures. Most organic insulators “char,” slowly transforming them into more conductive simpler organic materials through a process known as “carbonization of insulation”[4]. In other words, the function of the insulator is slowly compromised.
In turn, arcing along these carbonized paths produces “scintillations,” dim flashes of red, orange, yellow, or white light. Scintillations and the fault currents associated with them are sporadic and highly intermittent. As scintillations and fault currents evolve and become more active, they generate pulses with high-frequency content. These pulses propagate through the home’s electrical network. This process, arc tracking, is a slow process that can take from a few weeks up to many years. These electrical discharges may eventually become continuous arc faults, resulting in a large flow of current and large energy releases (with correspondingly high temperatures) that can ignite a fire.
Detection. Central to the system is a plug-in sensor designed to detect electrical arcing and power quality problems. Electrical arcing produces impulsive signals at ignition and extinction many times in each 60 Hz electrical cycle. Impulsive signals produce broadband electrical noise, including high-frequency energy that propagates freely through home wiring, which behaves as a communications network at high frequencies. The sensor samples voltage at 30 MHz, providing high-resolution, high-frequency monitoring of the entire home. The sensor consists of custom-built hardware and digital signal processing capable of digitizing, detecting, and interpreting the medium to high-frequency content in these pulses. The overall system design considers the signal characteristics, channel transfer characteristics, and the noise environment of the home.[5]
For simplicity, this paper refers to sensor-identified electrical conditions that have the potential to cause a fire as ‘hazards’; generally, such hazards present as series arcing (conductor failing to conduct) or parallel arcing (insulator failing to insulate), and/or power quality problems. The system’s “signal library” includes proprietary high-frequency fingerprints corroborated from sensor-identified electrical hazards. This library is reinforced and grows with each hazard, forming a crucial component of its learning system. The system’s signal library and learning system details fall outside the scope of this paper.
Localization. Electrical fire hazards are often small and hidden and can be challenging to locate. Complicating this challenge further is the fact that these hazards and their signals are often intermittent in nature. The system underlies a service model whereby a Fire Operations Team, staffed by engineers and electricians, engages directly with the homeowner at the point that the system has detected an electrical fire hazard.
Based on the customer’s sensor data, the system’s signal library, and accumulated hazard knowledge, the team employs a standardized communication and troubleshooting protocol for each case to enable localization and mitigation of the hazard. Mitigation varies depending on the nature of the hazard. Some hazards require a homeowner to discontinue using and replacing a plug-in device; others stem from utility-side faults requiring the customer’s utility to mitigate the issue. If not falling under these two scenarios and deemed necessary, a licensed electrician is dispatched to a customer’s home to troubleshoot, locate and mitigate the hazard.
Importantly, in 100% of cases documented in this paper, the clear arcing or power quality problem signals were no longer present after mitigation. Worth noting, the system’s False Positive Rate is 0%. In every case where the system warned a customer of a potential electrical fire hazard, the hazard was verified and documented. This paper does not explore this process or the extensive data supporting it. Rather, we focus on the system’s Electrical Fire Prevention Efficiency and the metadata collected from each of the cases where the system identified, located, and mitigated a potential electrical fire hazard.
Performance Analysis
Electrical Fire Prevention Efficiency (EFPE). EFPE is defined herein as the ability for the system to prevent the full universe of what is generally classified as fires involving ignition from an electrical source. However, data collection on residential electrical fires is generally independent and incomplete.[6] Consequently, we begin with our estimate of 50,000 annual electrical fires and 120M million dwelling units; this translates to an incident rate of one fire in 2,400 dwelling units (from now on referred to as ‘homes’) annually.[7]
Figure 1 charts the expected distribution of electrical fires based on this incident rate. With nearly 65,000 monitoring years, we would expect approximately 27 electrical fires across all homes with the service (64,656 home years / 2,400 homes = 26.9 fires). However, only three electrical fires were reported.[8]
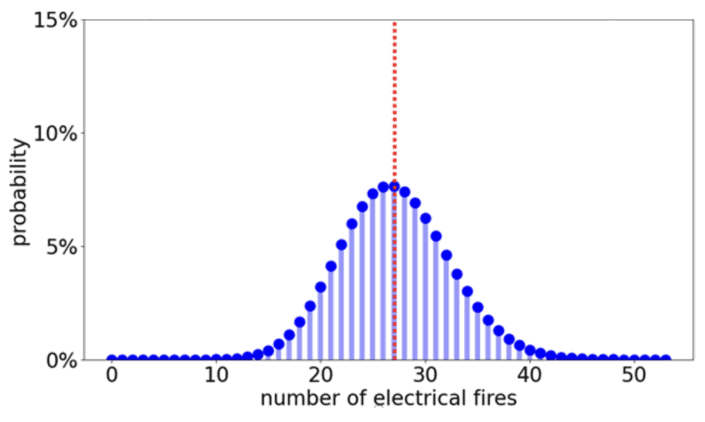
Figure 1 – Probability Distribution, Expected Electrical Fires, Fire Incident Rate Assumption of 1 in 2,400 Homes
Next, in Figure 2 below, we calculate the probability curve of the system’s EFPE. We begin with a ‘prior’ assumption that all prevention efficiencies between 0% and 100% were equally likely, meaning there is no prior assumption that the system prevents electrical fires. The chart shows that after observing three electrical fires in 64,656 house years of monitoring, there is nearly a 100% probability that the system’s EFPE is greater than 60% and a 96% probability that it is greater than 70%. Moving to the right along the blue probability curve, there is a 78% chance of an EFPE greater than 80%. Slightly further along, there is an approximate 58% probability that the system’s EFPE is at least 85%.
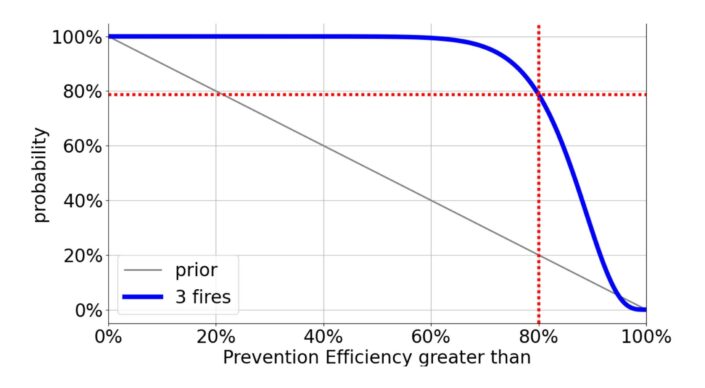
Figure 2 – Prevention Efficiency. If one electrical fire occurs every 2400 home years, then the probability of N fires in M home years is Poisson(M/2400, N). If the system prevents some fraction Q of those fires, the probability of N fires in M home years is Poisson(MQ/2400, N). To estimate prevention efficiency Q, apply Bayes’ theorem; observation of N fires in M home years modifies our prior probability distribution for Q by a factor of Poisson(MQ/2400, N). As a prior, we assume all prevention efficiencies from 0% to 100% are equally likely.
The data indicate that the system is preventing a significant majority of electrical fires. As a learning system, each potential electrical fire prevented – or each fire experienced by a home where the system is installed – generates additional input into the system’s machine learning algorithms. With this learning model, it would be expected that the EFPE will likely increase beyond its current level.
It is important to note that the system is not currently designed nor expected to prevent all electrical fires. There are two primary classes of electrical fire causation events for which the system is not currently designed to detect and mitigate:
- Immediate and catastrophic failures. Some electrical failures that cause electrical fires can occur immediately and catastrophically. The system is designed to detect low-level, incipient arcing events that develop slowly over extended periods (days and weeks typically) that can progress in severity to produce ignition. While the system does “see” these types of failures, it is not designed to alert on these failures.
- Glowing connections that do not produce arcing. It is known that loose conductors can produce high resistance, “glowing” connections that produce high heat sufficient to ignite fires. The conditions do not necessarily generate arcing that the system is designed to detect. Our experience suggests that many of these conditions generate periodic arcing that the system detects. Many of the hazards detected, localized, and mitigated were high resistance connections that were, or had produced, high heat glowing conditions. However, this specific condition does not always produce sufficient signals for the system to detect and mitigate.
Hazard Analysis
More than 1,000 cases – or hazard detection and mitigation events – have been documented at the time of this paper. Each case is an event where the system detected, localized, identified, and mitigated an otherwise hidden hazard before the potential ignition of an electrical fire (refer to Appendix A for typical photo evidence received for each case). We explore the data associated with these further below.
Definitions. For this paper, we classify potential fire hazards found as either an Electrical Fire Hazard (EFH, those generally found in the home) or a Utility Fire Hazard (UFH, those related to electric utility infrastructure).
EFH: Electrical fire hazards in homeowner devices, appliances, home systems, and
home electrical infrastructure
UFH: Electrical fire hazards introduced into the home by electric utility infrastructure
EFHs correlate directly to what are generally considered traditional ignition sources for home fires. Typical hazards include but are not limited to loose wiring connections; damaged or compromised wiring insulation; faulty panels or circuit breakers; and faulty devices/appliances, such as water heaters, sump pumps, radon pumps, heating pads, or power supplies. A hazard must have been first found by the system to be included in these figures. In every case, it is confirmed that remediation of a given hazard ‘removes’ the signals detected by the system, proving that a specific device or infrastructure was the source of the signal. In most cases, the device that was the source of the hazard signal shows physical evidence that indicates a fire hazard, too. Typical physical evidence includes charred wires, melted or charred plastic, wet tracking, or other evidence confirming that the device is unsafe.
Separately, UFHs represent a subset of issues related to grid infrastructure not documented to any level of detail until now. More specifically, we define UFHs as electrical fire hazards introduced into the home by ‘last mile distribution’, or electric utility infrastructure proximal to the home. Typical UFHs include a loose neutral or loose hot at the meter, weatherhead, service line, or transformer, sustained high or low base voltage, overloaded or faulty transformer, and grid arcing.
An important distinction is required here: the hazards detected and documented by the system in this paper – UFHs – do not include the full spectrum of grid faults that have been studied separately at length by other parties. For example, the Electric Power Research Institute (EPRI) described a number of different hazards by voltage level (distribution through transmission) and region of the country.[9] That research revealed that equipment failure comprises the largest reason for voltage sags on the utility grid. However, lightning, vegetation, and animal contact are also frequent causes of utility failures. The system provides a network effect as sensor density increases in a given geographic region. Consequently, many of these grid faults are detected by the home-based sensor network; however, these faults and the system responses to them are not in scope for this paper.
Hazard Frequency in System-Monitored Homes. The data shows that these UFH hazards occur more frequently than EFHs. The system has detected EFHs in 1 in 169 homes and UFH’s in 1 in 112 houses to date. The combined annual rate across the above classifications – meaning the combined number of EFHs and UFHs identified, certified, and mitigated – is 1 in 67 homes, with a false alarm rate of 0%[10] (Figure 3).
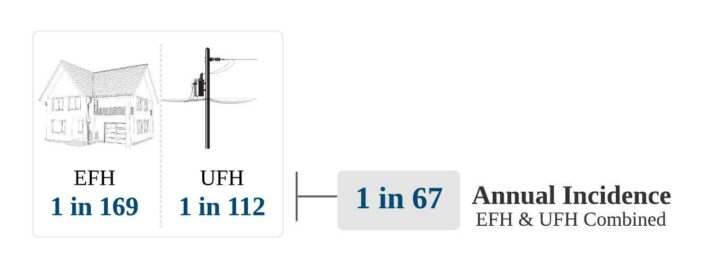
Figure 3 – System Metrics: Identified EFH and UFH Hazards
EFHs. As expected, most EFHs identified by the system were due to some form of hazardous electrical arcing (Figure 4). The balance of EFHs includes high resistance (H/R) wiring/connections (1.7%) or glowing connections (0.5%, blue slice, not labeled).
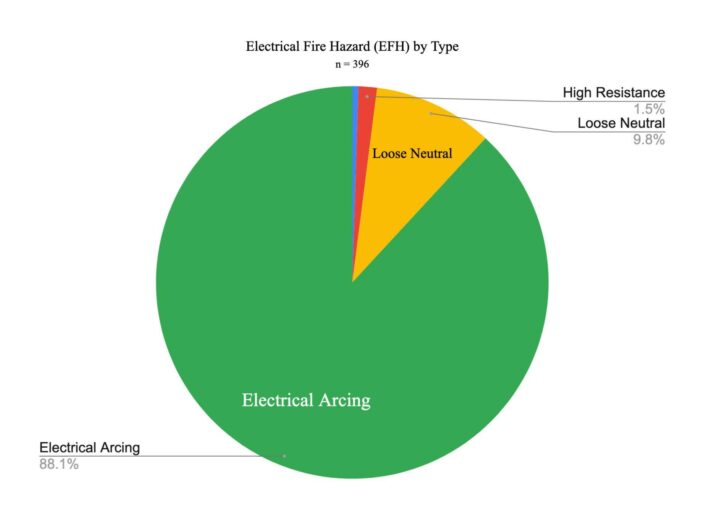
Figure 4 – EFHs by Type
Of all EFHs, approximately one-half, or 50%, were device/appliance-related. The remainder of the hazards were from home infrastructure (wiring, outlets, switches, breakers, and panels). According to estimates, 39% of reported fires due to Electrical Failure or Malfunction stem from wiring and related equipment; however, these fires caused a disproportionate amount of losses at 46% of all losses.[11] Everything but Device/Appliance can be considered “Home Electrical Infrastructure” in Figure 5 below.
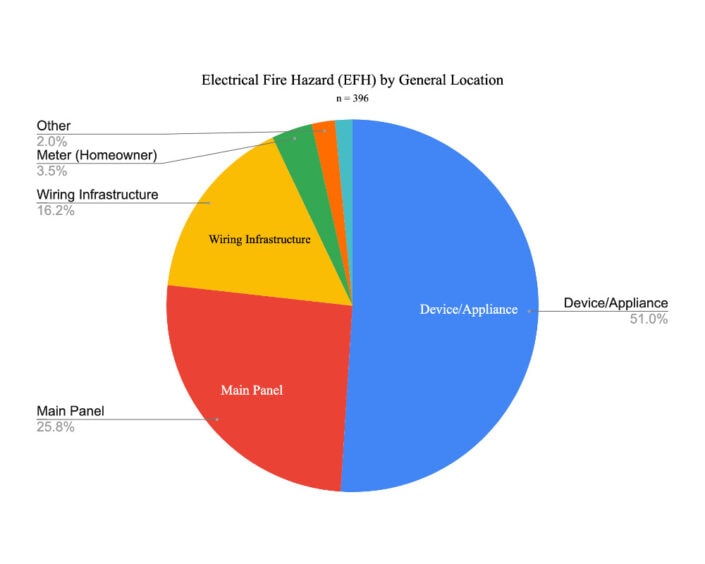
Figure 5 – General Location of EFHs [12]
Figure 6 depicts EFH identification by room/area. The location of a portable device, such as an electric blanket or laptop charger, falls under ‘Other.’ Similarly, today, any hazard found in the attic (e.g., radon pump, light fixtures) is classified here as well.
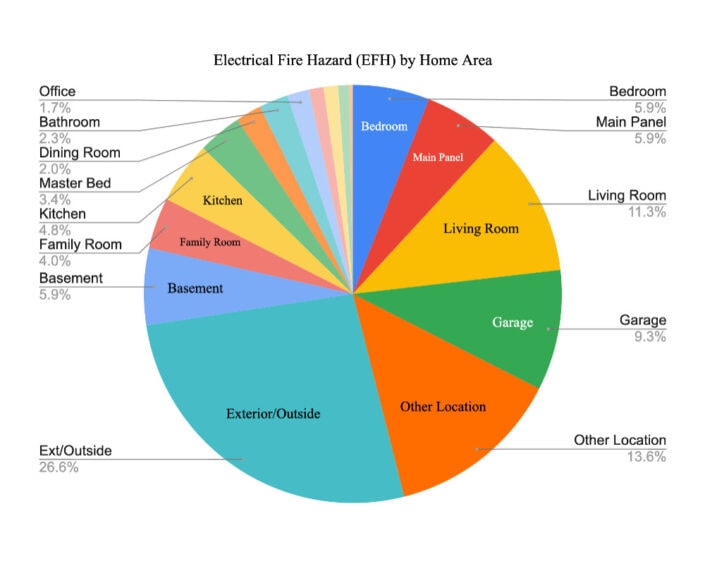
Figure 6 – Relative Location of EFHs within the Home [13]
Because of the fundamental differences in home electrical infrastructure and what is either hard-wired or plugged into it, we further break out EFHs below: Electrical fire hazards in homeowner devices, appliances, and home systems, versus those found in home electrical infrastructure (wiring, outlets, switches, breakers, and panels).
EFH – Electrical Fire Hazards in Devices, Appliances, and Home Systems. These hazards are separate and distinct from those associated with a home’s existing electrical infrastructure. Importantly, the data reveals that home age is not a leading determinant of electrical fire risk where devices, appliances, or home systems are the hazard source. Figure 7 shows frequency by type of device. Of this segment of hazards, light fixtures represent the largest proportion of electrical fire hazards to date. These include chandeliers, flush mount ceiling lights, sconces, outdoor lighting, and desk or floor lamps. Some were due to poor device quality, others to shoddy installation or device age.
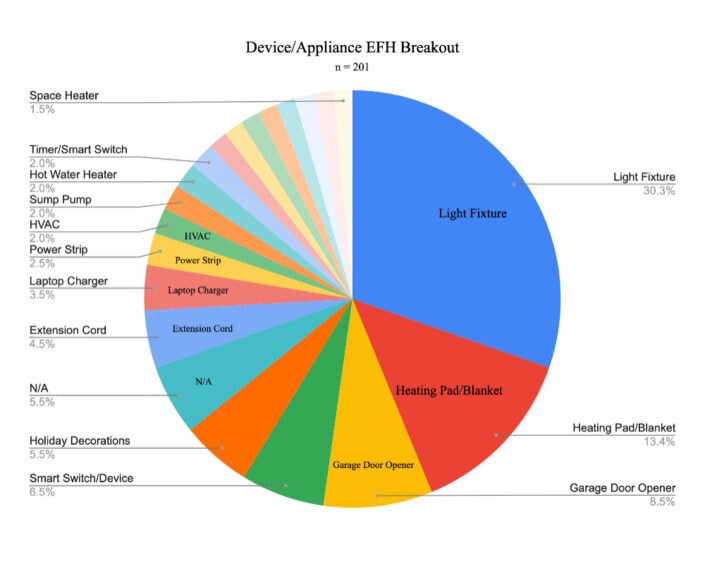
Figure 7 – Electrical Fire Hazards (EFHs) from Devices & Appliances [16]
EFH – Electrical Fire Hazards from Home Electrical Infrastructure. These hazards include those associated with a home’s existing electrical infrastructure, where electrical system components are generally hidden from everyday view. Such components include wiring inside walls and above ceilings, electrical outlets, wall switches, electrical panels (either the panel itself or circuit breakers enclosed inside the panel), and on the homeowner’s side of the electric utility meter. Figure 8 provides a breakdown by hazard location.
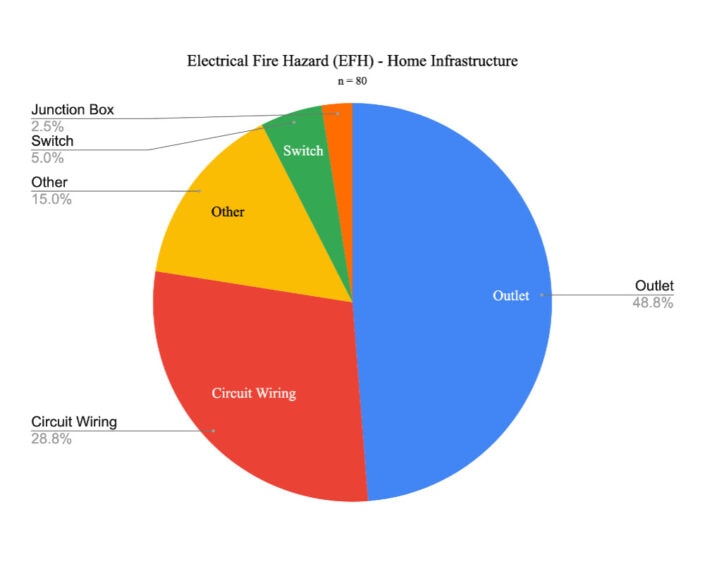
Figure 8 – Electrical Fire Hazards (EFHs) in Home Electrical Infrastructure
UFH – Home Electrical Fire Hazards from Electric Utility Infrastructure. These events are sustained hazards associated with the electric utility’s local distribution infrastructure, including distribution transformers, meters, and respective connections. It is important to note that the system provides real-time, continuous monitoring of utility power quality and provides notifications to customers of short-term power quality events, such as surges, brownouts, and outages. In contrast to the sustained hazards that form the UFHs identified by the system, short-term events are often caused by weather and grid infrastructure faults and are out of scope for this paper.
UFHs detected and identified by the system are typically the result of one or more of the following:
- loose/poor neutral connections
- loose/poor hot connections
- sustained high voltage (overvoltage)[17]
- sustained low voltage (undervoltage)
- failing/overloaded transformers
- grid arcing
Figure 9 provides a breakdown of these hazards. Note that loose or open neutral conditions can exist on the homeowner side or utility side of the meter. To date, the system documents that nearly 95% of these conditions exist on utility-controlled infrastructure.
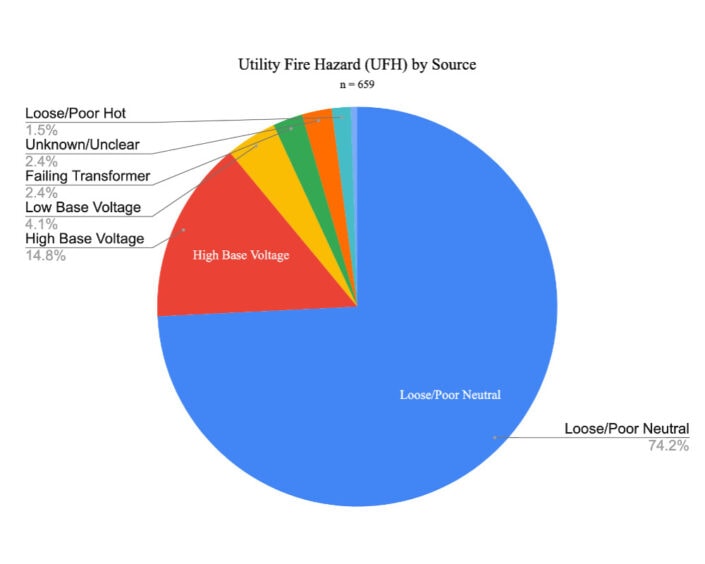
Figure 9 – Utility Fire Hazards (UFHs) [18]
- an electrical fire in the home,
- damage or destruction of devices and appliances in the home,
- electrocution risk, and
- a wildfire ignition threat (in arid climates).
The system does not prevent power quality issues; however, it demonstrates the ability to detect conditions leading to power quality concerns such as voltage fluctuations, various maintenance-related issues, weather and utility disturbances, and high concentrations of electronic equipment. These detection capabilities can play a key role in preventing or mitigating equipment and property loss. However, this topic is outside the scope of this paper. The full impact of equipment and property loss in the residential segment due to these issues has yet to be fully explored, yet, a look at claims data for small and medium businesses provides us insight into how important power quality issues can be no matter the structure in question: according to one program, nearly 45% of claims are related to a power quality issue.[19]
Hazards and Home Age
With each case – where an electrical fire hazard was detected and mitigated – system data is matched to available 3rd party metadata regarding the age of a home, size of a home, and other data points. We expand on this below.
EFHs and Home Age. A review of the first two columns on the left in Figure 10 indicates that ~81% of all EFHs occurred in homes greater than 20 years old. Notably, approximately 80% of all homes in the U.S. are greater than 20 years old.[20] While on the surface, this seems to suggest that detected EFHs, in general, do not skew to older homes, further analysis that incorporates the age distribution for all system-protected homes is needed.[21] This analysis will be covered in a separate paper.
Notwithstanding this, we observe some interesting data when EFHs are further segmented into devices/appliances and home infrastructure segments.
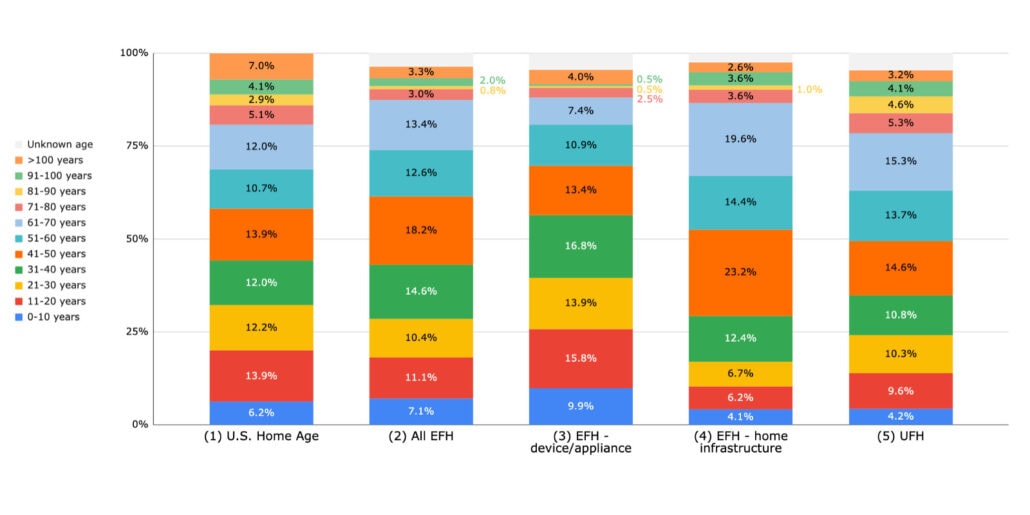
Figure 10 – Overall Hazard Distribution by Home Age
EFHs from home infrastructure. In general, older homes are at higher risk for experiencing an electrical fire from aging infrastructure. With over 100 years of residential electrification in many cities and towns, the aging of the residential electrical infrastructure remains a concern within the electrical and firefighting communities.[22] Besides the natural effects that age can have on wire insulation and electrical equipment over time, residential electrical systems are seldom inspected after their original installation. In addition, the quality of the original installation may be a factor, as well as inappropriate upgrades or additions that unqualified homeowners or others may have done throughout the years.
Specifically, we find that when isolating EFHs related to home infrastructure – effectively removing those attributed to devices/appliances – EFHs skew more towards older homes (compare column 1 to column 4 of Figure 10). This finding is not unexpected. For example, ~80% of all U.S. homes are more than 20 years old, but ~90% of EFHs from home infrastructure occur in homes more than 20 years old. Similarly, ~56% of U.S. homes are more than 40 years old, but ~72% of EFHs from infrastructure occurred in homes more than 40 years old.
EFHs from devices/appliances. The above finding also suggests that EFHs due to devices and appliances, in contrast, don’t skew toward older homes. Rather, they seem to skew towards newer homes (compare column 1 to column 3 of Figure 10). This finding was somewhat surprising. Many devices and appliances experience replacement life cycles far shorter than those of a home and its infrastructure. Their more frequent replacement cycles mean we would not expect them to skew to either end of the home age distribution. While ~20% of U.S. homes are less than 20 years old, ~27% of device and appliance hazards occurred in homes less than 20 years old. Similarly, ~44% of U.S. homes are less than 40 years old, but ~59% of these device/appliance hazards reside in homes 40 years or less in age.
UFHs and Home Age. Data suggest that UFH hazards skew towards older homes and suggests that older homes in older neighborhoods generally have older or possibly outdated grid infrastructure (compare column 1 to column 5 of Figure 10). For example, ~80% of all U.S. homes are more than 20 years old, yet ~87% of UFHs occur in homes more than 20 years old. Similarly, ~56% of U.S. homes are more than 40 years old, but ~66% of UFHs occurred in homes more than 40 years old. This finding may indicate that older homes in older neighborhoods generally have outdated grid infrastructure relative to newer communities, which is not surprising. But, equally important, the data clearly shows that newer homes and communities are not immune to these types of electric utility hazards. This data is useful and can be used to produce community grid resilience scores.
Importantly, as system data accumulates, the statistical significance will further increase. The system is deployed in homes in every U.S. state, and geographic dependencies are being tracked; however, the data are not yet statistically significant on a localized geography basis. This will also change as home distribution and system data accumulate.
Conclusions
The data support that the system prevents a significant majority, 80%, of electrical fires, consequently preventing losses. System and hazard data are novel and informative, representing new residential electrical data not previously available. The data also demonstrate that the system is virtually free of false alarms and false positives.
New Fire Prevention Data. The data relative to hazard discovery, isolation, and remediation holds promise to better inform approaches to electrical fire prevention and analysis – both inside the home and with utility providers. Currently none of the existing databases for residential fire data have all of the characteristics desired for residential electrical fire data, making it important to leverage the use of the internet of things, cyber physical systems, wireless sensor technology, artificial intelligence algorithms, smart grid applications, etc. to inform the evaluation of the residential electrical fire problem through future efforts[23]. The system offers a new data set that can help inform how fire data might be further analyzed and understood. Importantly, the data resulting from each system hazard case is well-suited to inform better design, standards, and practices relative to safety and resiliency across several fronts.
Impact on the Grid and its Operators. UFHs and their remediation data improve the grid one home at a time – and in groups of homes or communities – relative to how ‘last-mile distribution’ is configured in a given area. The precision of data from these hazards demonstrates that real-time actionable data at this segment of the grid is valuable to both homeowners and utilities. The benefits extend beyond homeowner and community safety, including fewer utility truck rolls, higher ‘problem found’ rates and increased situational awareness.
Beyond Fire Prevention. The electrical fire hazards identified by the system often include home systems or appliances whose reliable operation is essential for safe conditions in the home. In many cases, they appeared to be operating normally to a casual observer. In others, they were failing, not working all the time, or not operating at all while showing no external signs of an inherent electrical fire hazard. In these situations, the system’s identification of these fire hazards also enabled the homeowner to repair or replace the system or appliance before having the chance to fail and create unsafe conditions in the home. Examples include radon pumps, sump pumps, water heaters, well pumps, HVAC units, and portable heaters. Similarly, the system has also documented failing sump pumps, water heaters, and arcing due to water from indoor plumbing leaks.
More to Come. While the data used to present these findings is statistically significant, it is in its infancy relative to the total number of homes in the U.S. and the potential for expanded analysis. As distribution continues to more homes and additional monitoring years are accumulated, more insights will be gained, allowing expansion upon this initial paper. Further research or reporting may include:
- Comparison of system hazard location data with National Fire Incident Reporting System (NFIRS) residential ignition location data
- Expansion of hazard analysis with other home metadata
- Hazard frequency analysis relative to home age distribution across all system-protected homes
- Deeper analysis of device/appliance hazard data by device type, manufacturer, and age
- Analysis of community grid resilience by geographic region
- Comparison of network sensor hazard data with broader power industry studies, i.e., grid fault metrics
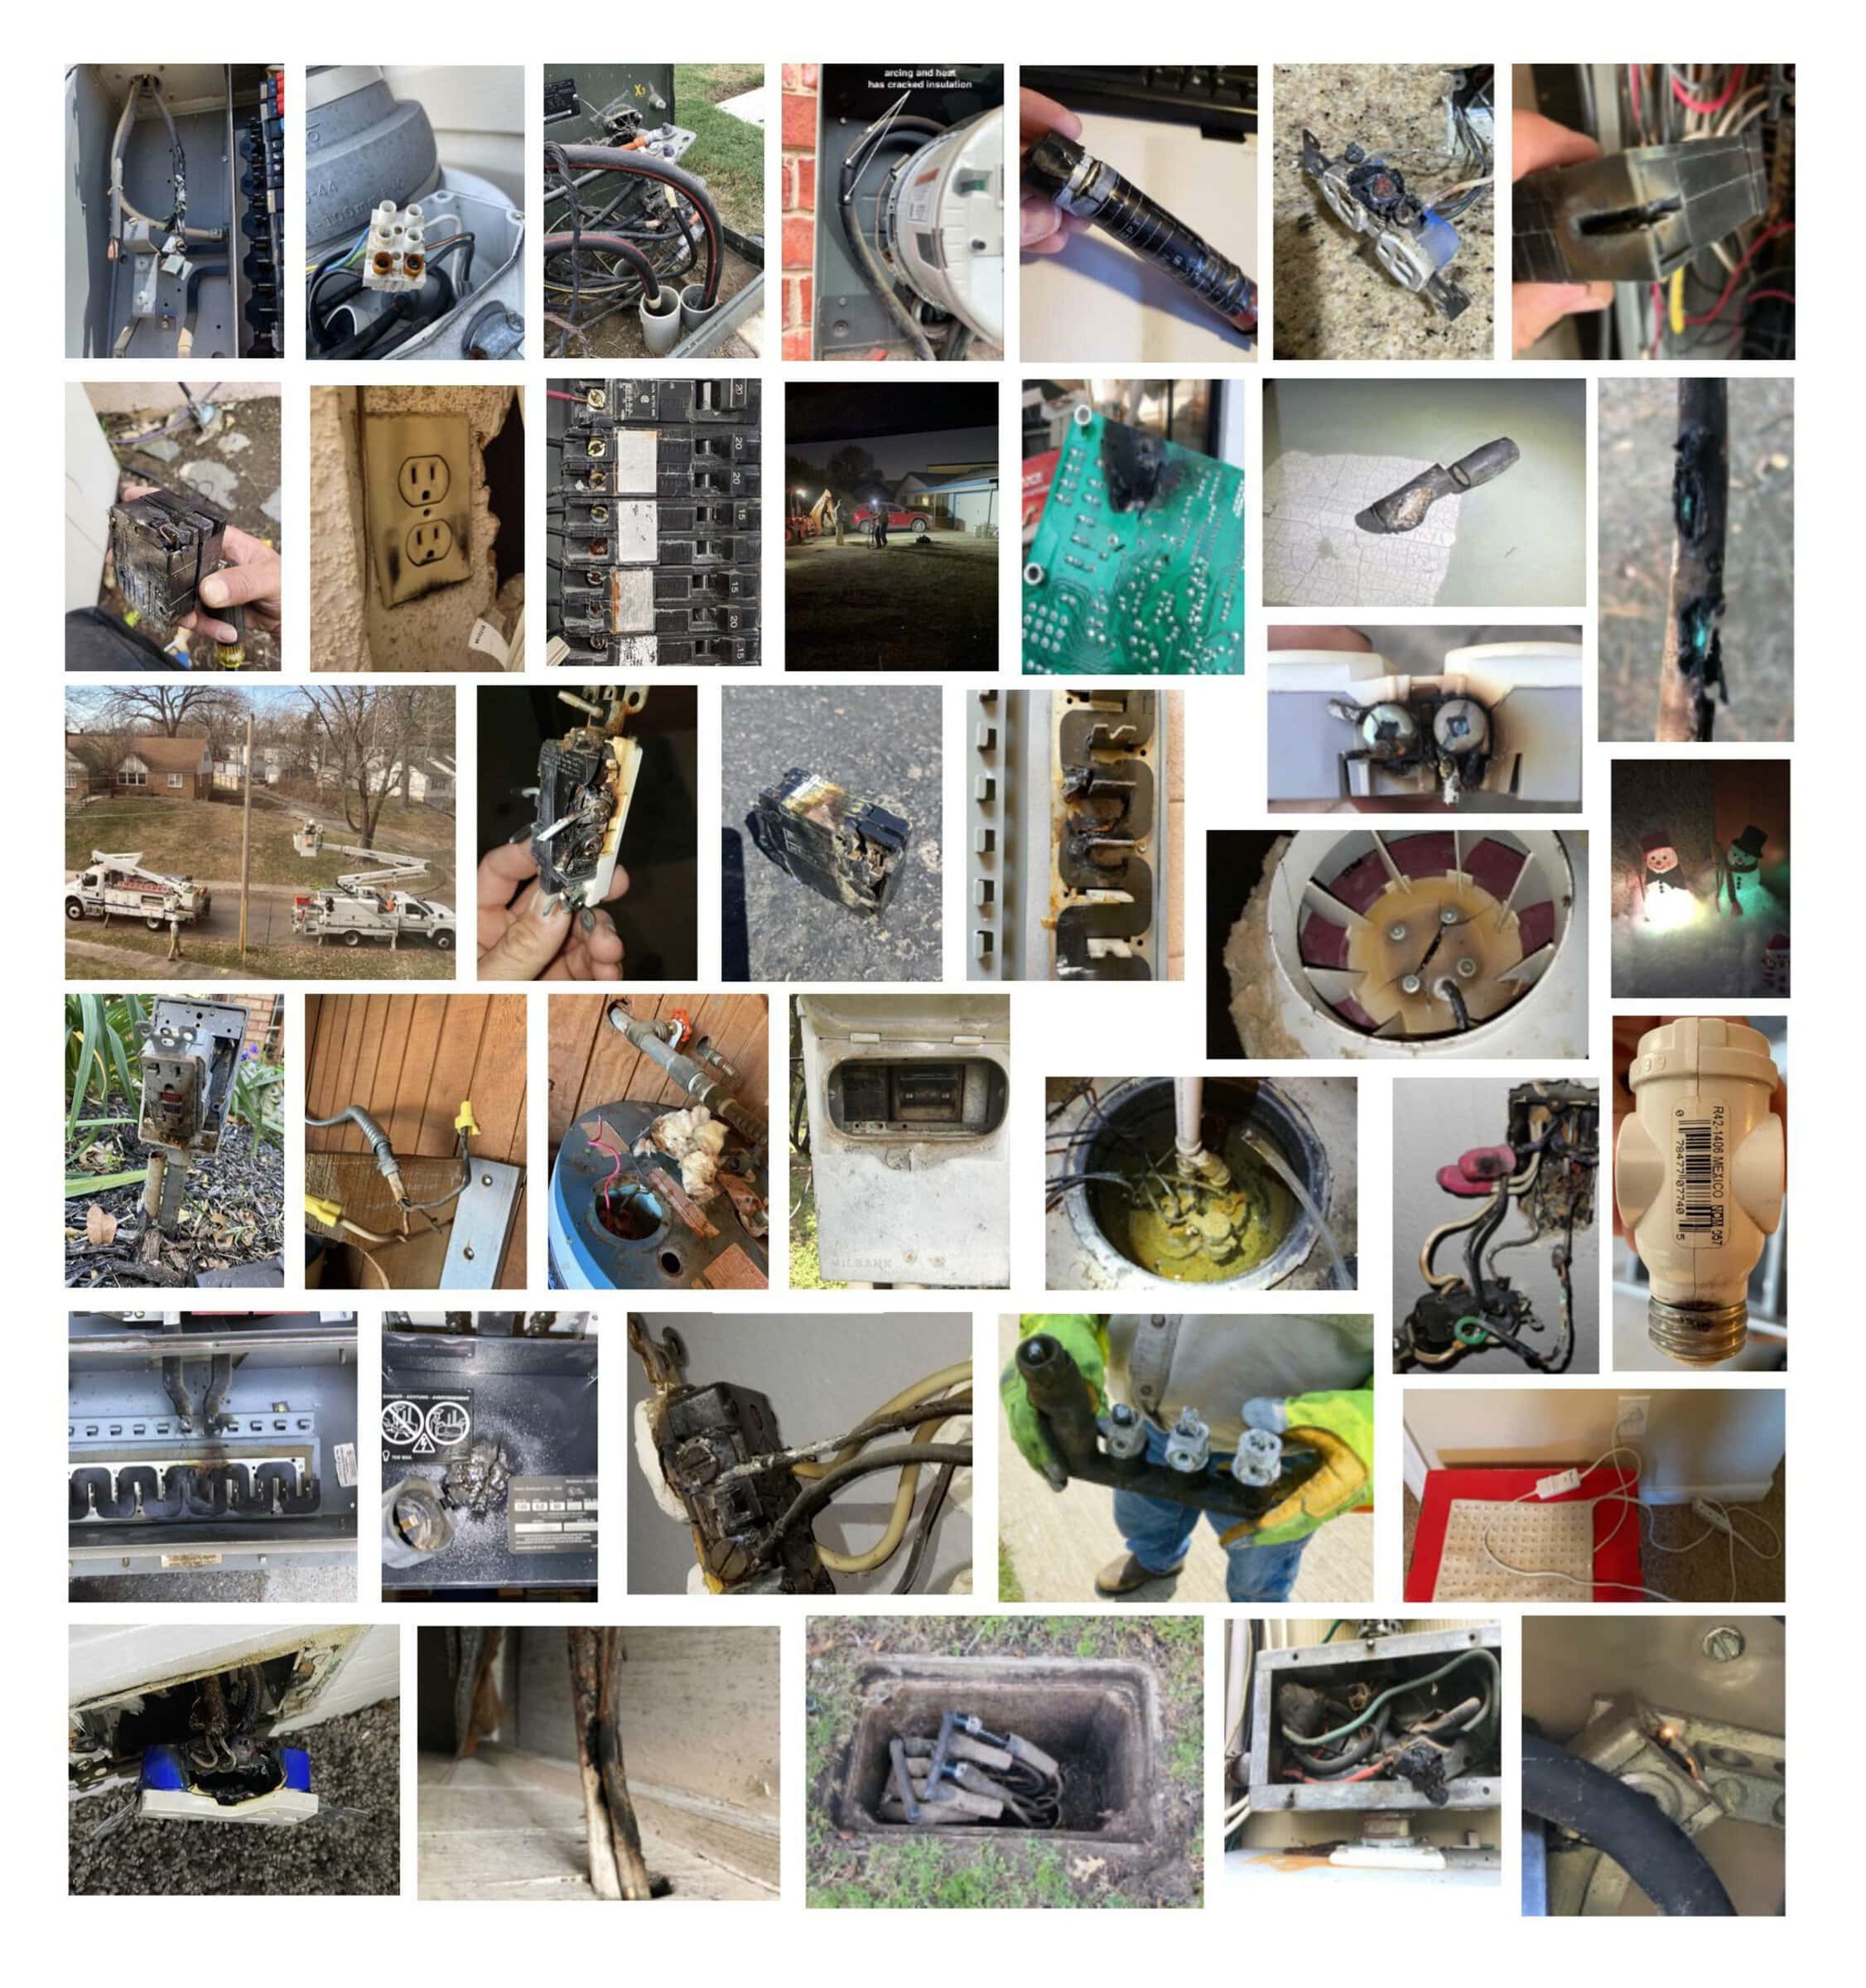
Appendix A
Typical photographic evidence documenting electrical fire hazards (both EFH and UFH) detected by the system. All were identified, localized, identified, independently confirmed, and mitigated.
Endnotes
[1] Estimate, leveraging the most recent projections by the National Fire Protection Association (NFPA), Home Electrical Fires, March 2019, covering five years from 2012-2016, using NFPA’s proprietary data, NFPA Fire Experience Survey, and National Fire Incident Reporting System (NFIRS) data. NFPA National estimates are projections based on data from NFIRS Version 5.0 and NFPA Fire Experience Survey. Based on these estimated data sets and for simplicity, we assume a base of 120M homes and approximately 50,000 annual electrical fires, equating to a rate of 1 in 2,400 homes annually experiencing a fire event due to electrical ignition.
[2] Ting, by Whisker Labs.
[3] Shea, J. J. (2011), Identifying causes for certain types of electrically initiated fires in residential circuits. Fire and Materials, 35: 19-42. doi:10.1002/fam.1033
[4] Billings, M. J., Smith, A., and Wilkins, R., Tracking in Polymeric Insulation, IEEE Trans. on Electrical Insulation IE-2, 131-137 (Dec. 1967)
[5] Heckman, Sloop, Babrauskas, Hoppmann, Schetrit (2018), Ting: A device to alert homeowners of scintillations which precede electrical fires.
[6] Hutchison, V., Fire Protection Research Foundation; Residential Electrical Fire Problem: The Data Landscape (October 2018)
[7] Reference footnote 1 for details.
[8] Whisker Labs is made aware of any suspected electrical fires in system-monitored homes directly from residential customers or from their insurance company partners. Three electrical fires were reported during this same period.
[9] Distribution System Power Quality Assessment: Phase II—Voltage Sag and Interruption Analysis, EPRI, Palo Alto, CA: 2003. 1001678.
[10] There were no documented cases where a home simultaneously had an EFH and a UFH.
[11] NFPA Home Electrical Fires Supporting Tables, March 2019, Campbell, Richard
[12] Not labeled in graph due to space limitations: Subpanel: 1.5%,
[13] Not labeled in graph due to space limitations: Subpanel: 1.1%, Detached Structure: 1.1%, Laundry/Utility Room: 0.8%, Master Bedroom: 0.3%.
[14] Where electric utility responsibility ends and customer responsibility starts is not universal and can vary by utility and type of structure.
[15] A future expansion of this analysis might compare hazard location data with reported fire ignition source data in NFIRS.
[16] Not labeled in graph due to space limitations: Radon Pump: 1.5%, Kitchen Appliance: 1.5%, Well Pump: 1.5%, Pool Equipment: 1.5%, Dryer: 1.5%, Curling Iron: 1.5%, Aquarium: 1.5%.
[17] Overvoltages and undervoltages generally are not the result of system faults; IEEE Std 1159™-2019, IEEE Recommended Practice for Monitoring Electric Power Quality Developed by the Transmission and Distribution Committee, p24.
[18] Not labeled in graph due to space limitations: Grid Arcing: 0.5%.
[19] Claims data from Hartford Steam Boiler’s (HSB’s) Commercial Equipment Breakdown Insurance program for Small to Medium Enterprise (SME) accounts (O’Shaughnessy, J.).
[20] U.S. Census data U.S. Census Bureau (Census), American Housing Survey Data Tables, 2019 National – General Housing Data, total detached and attached home structures.
[21] It is not assumed here that the age of homes protected by the system represent the same general distribution as all US homes; analysis of this data is ongoing; this additional data dimension will be presented in detail in a future version of this paper.
[22] Residential Electrical System Aging Research Project Technical Report July 1, 2008, The Fire Protection Research Foundation; prepared by David A. Dini, P.E. Underwriters Laboratories Inc.
[23] Hutchison, V., Fire Protection Research Foundation; Residential Electrical Fire Problem: The Data Landscape (October 2018
© Copyright Whisker Labs 2022